
Looking at a chart is like looking at a complex painting. Everyone has their own interpretation. Likewise, being able to see trade setups takes a trained eye and everyone has their own approach. Today, Duncan from Swing Trends is going to show us how he uses Gann Swing Charts to analyze futures.
=====================================================================
One of the largest problems in trading any kind of financial instrument is how to analyze price action. Present 10 different traders with a given candle chart and ask them to classify market trend, support and resistance and chart patterns and the chances are you will receive 10 different looking sets of analysis in return. Not only is it likely that traders will differ substantially in the important areas identified, present the same trader with the same chart, at a different time, it is highly likely that the two charts you will now have will be different to each other.
The majority of traders who do not have an objective technique for analyzing price action will suffer from this inconsistency in their identification of market trend, support and resistance and chart patterns as their analysis is purely subjective – based upon human judgments and as we all know, humans do make mistakes and the decisions we make are often affected by the circumstances we find ourselves in. For example, place a human under pressure and we are more likely to make those mistakes. Being in danger of losing your own money in the financial markets, is one of the highest pressure situations you can find yourself in.
Consequently, as a trader, being able to make consistent and correct decisions in this environment is very important. Not only is your own money at stake, but the environment in which you find yourself each day encourages to make mistakes in managing that money. It is for this reason at Swing Trends, we aim to remove as much of the subjective decision-making as possible from trading. This removes pressure from a trader, lessens the chance incorrect decisions being made and helps keep emotions in check. All of which can increase ones profitability.
By using W.D. Gann’s 3 period swing charts as an objective guide to market trend, support and resistance and chart pattern formations we achieve this.
What are “Gann 3 period swing charts”?
Simply, a Gann “swing chart” is an objective way of assessing market price action and judging where market “highs” and “lows” have occurred. These highs and lows can then be used to judge trend, the location of support and resistance and to define chart patterns. It is termed a “Gann” swing chart as it was “invented” by William Delbert (W.D.) Gann. “3 period” describes the minimum number of candles needed to form a price “swing” and acts a little like a smoothing mechanism...(shorter period swing charts tend to feature more swings and react more quickly to changes in market trend, but equally are more prone to whipsawing and false signals, whereas longer period swing charts tend to react slower to changes in market trend but produce fewer false signals).
Now how does one draw a Gann 3-period swing chart?
Drawing a “Gann 3 period swing chart”:
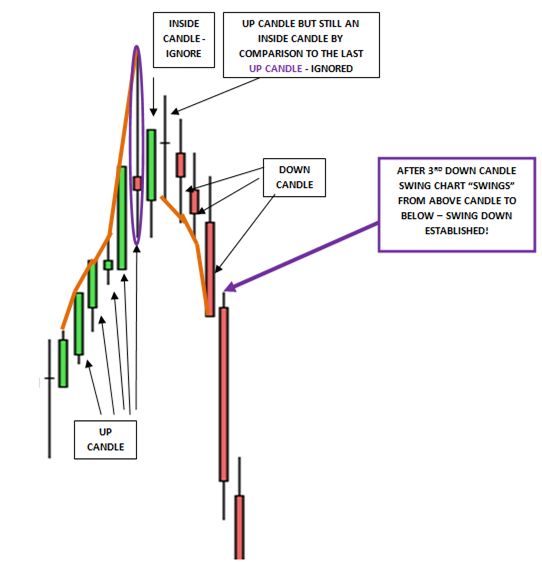
A swing chart is a line superimposed on a bar or candle chart of price action, highlighting the “swing highs” and the “swing lows”. A candle with a higher low and a higher high than the previous candle is known as an “up candle”. As prices rise (due to a series of consecutive up candles) one draws a line connecting the highs of each candle. Inside candles (those days with a higher low and lower high than the previous candle) are ignored.
Down candles are also ignored until (according to W.D. Gann) 3 consecutive down candles occur. At that point the line you have been drawing between candle highs “swings” to the bottom of the 3rd down candle. Again “inside days” are ignored, as are “up” days until 3 occur consecutively.
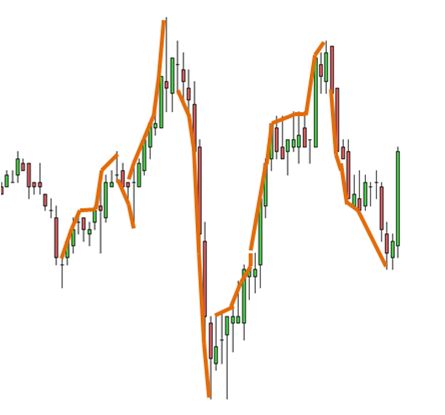
The result on a large scale tends to look like a set of irregular waves.

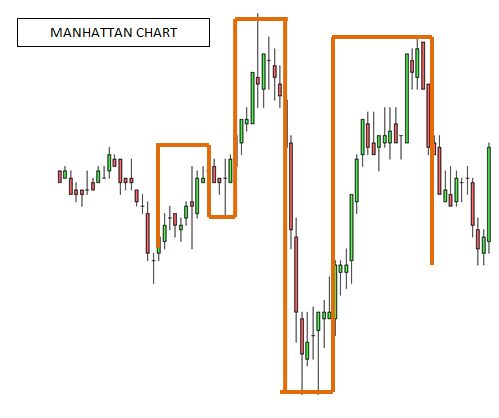
Although this is normally simplified using a “Manhattan chart” that simply picks out and links the Gann swing highs and Gann swing lows.
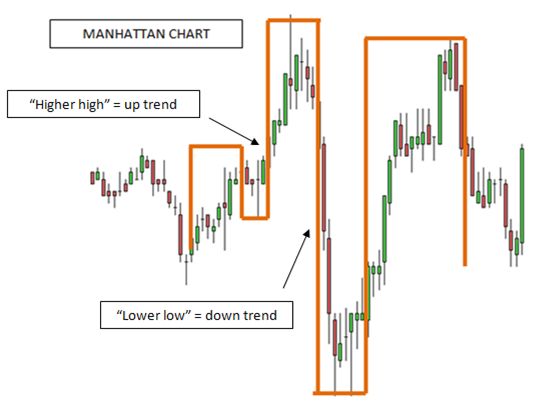
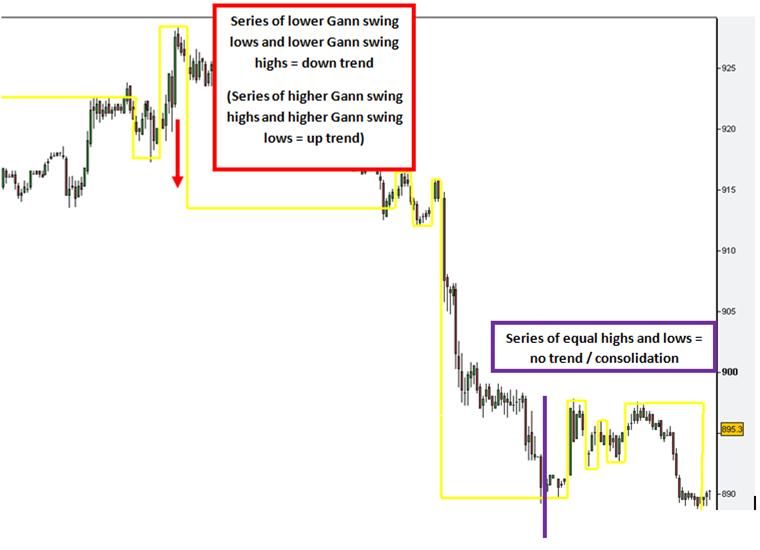
Gann swing trend is then simply calculated using the placement of each consecutive Gann swing high and low - with a series of higher highs and higher lows forming a Gann swing uptrend, and a series of lower highs and lower lows forming a Gann swing downtrend.
That all sounds nice easy doesn’t it?
However, in the real world, it is very rare that you will see “3 consecutive” down candles without one, or sometimes even two up candles in between, which would mean normally, even if price moved a significant distance, one wouldn’t be able to class it as a Gann price swing. For example:
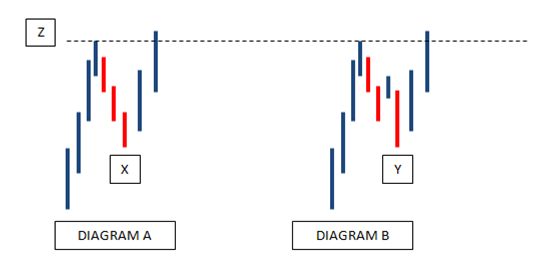
Observe diagrams A & B. (Assume trend is up). The “standard” Gann 3 candle pullback is shown in diagram A. A swing low is established at point X. According to W.D. Gann, point Y in diagram B would not qualify as a swing low, because down days are not consecutive. In reality I suggest there is little difference between diagram A and B, so little in fact, one can suggest they are substantially the same. Consequently, I have chosen to modify a traditional Gann 3 period swing chart by relaxing the requirement for there to be 3 “consecutive” days in order for a Gann swing to be formed. I use the definition of 3 lower lows (without there being a new higher high – i.e. higher than “Z” in-between).
Uses of a Gann 3 period swing chart
Defining Market Trend:
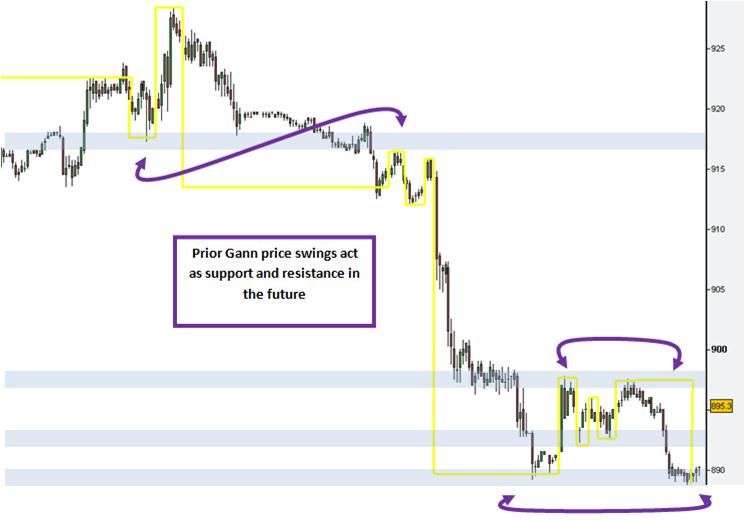
Defining support and resistance:
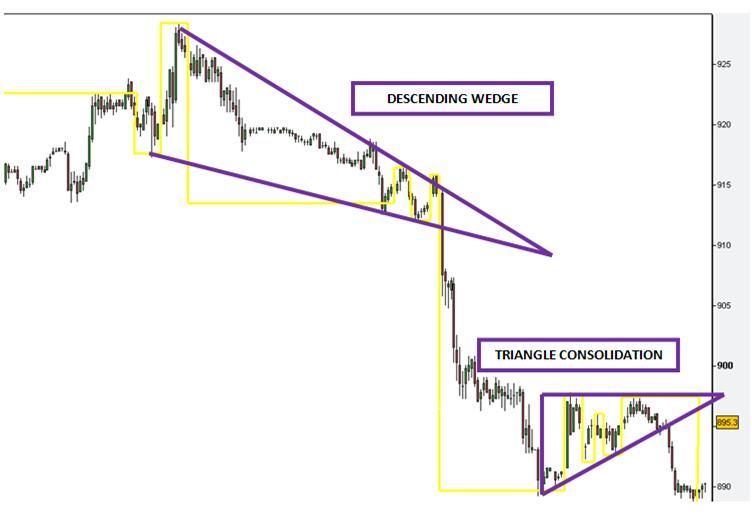
Defining Chart Patterns
These three uses perform possibly the three most important functions in futures trading. At Swing Trends we use these techniques every day (along with a few other technical analysis techniques) to build a specific trading plan for each day, before the market even opens.
All the best of luck for today’s trading!
Duncan
Swing Trends – Daily Technical Analysis of ES E-mini & Futures
=====================================================================
Aside from daily analysis Swing Trends also runs a free market analysis chat room where members may talk to Duncan and to each other as the market moves live. Be sure to stop by and check them out at Swing Trends.
I am intrested to learn gann theory..any one intrested to teach me the gann theory.
hi..all.i've been trade in futures market,especially in hanseng Index n nikkei 225 index nearly 3 years.many techinal i've use in my trading but always have loss.can u make a simply daily chart how to using "swing trends" in maket hangseng or nikkei?
or any one can help me how to trade in derivative market like hangseng n Nikkei 225.thx GBU
Good stuff!
Thanks for your take on Gann. Always wondered where you got your directional "bias" from when you traded in a previous room. Thanks again for the analysis. Will take a closer look at this technique. Steve.
Hi Narendrakumar, It certainly is possible to draw Gann swings on commodities and currency price charts. In addition to trading indices futures I also follow some currencies including EUR/JPY and EUR/USD. I have found Gann swing charting to work well in this arena too.
gannnnnn
Gann never told ANYONE how he really did it. His mentor was one with the 4th alphabet with 'r'. Most if not all will never get it. He used one method to get "Time" not price.
Just like the market, most if not all will never get it. And Buffet...is no wizard...if you know anything about math.
If you really want to know where the mkt is going its quite simple.
All the magic numbers are in the Bible...all of them and therefore in math. But nobody wants to listen about spirituality nor wisdom. You don't have to be religious to acknowledge the wisdom of the bible...Old and New testament. After all Jesus was a rebel....but nobody gets it.
When you get this wisdom you know exactly where the mkt is going in the macro picture. For example...here is a freebie...the US index and the dollar is going to crash ( ok everybody guru is saying it....I mean loser is saying it)..but it will pop up some and then crash. But, it will make a resounding high in 2018/2019.
The new bull mkt will begin ONLY IN 2016 WHEN....???? =
Remember..."Nobody knows what YOU THINK THEY DO." IF more people did not listen to Wall Street and all the academic..wazoos...they would have never lose money....
Then again....losers...never listen nor learn. Its all in the mind !!!
Finally, One world currency will happen..not because its good...but because all you "losers" believe it will be good...just like globalization was suppose to make you rich....but you got broke beyond belief.
BAAAAAAAA..yes the sound of SHEEP !!..But I'm a rebel..just like Jesus and I saw it coming a long time ago.
Will you ever learn!!!
Well one positive thing from your post S. the world won't be ending in 2011 like our dear friend Mr. Camping is saying.
But seriously, I too get it. I get that the whole thing is smoke and mirrors... numbers in there purest. Unfortunately, I get it but I'm not smart enough to figure it out. I've gotten better in the past few years, but one could argue that I've just been around long enough now to recognize some of the more obvious patterns and I know when to be patient and when to get out quickly. If only I had a mentor...
moz-screenshot-54.jpg is currently not showing, could you please upload that image again to have a complete posting?
Hi Narendrakumar, It is possible to draw Gann swings in both commodity and currency charts across multiple time frames. As well as analysing and trading futures I follow certain currency pairs including EUR/JPY and EUR/USD. I find Gann swing charts to also work well in this environment.
Sure does catch the market mves. Do more GANN charts please.
can you show gann swings in commodity charts or currency charts daily ?
Great information. I've never used Gann's work in my trading. But I'm going to research it more now. Thanks again.
Hi Guys, Thank you for the positive feedback - Im glad you liked the article. Objectivity is vital to my trading and for me using Gann swing charts provides that objectivity. JG, you are right that much of Gann's work is questioned however, some of this may be a result of his methods appearing complicated when first studied. Gann swing charts represent one of Gann's more straightforward techniques and with a little studying could improve many traders' profitability in my view.
Interesting read swingtrends. I myself use several elements from Gann's work, and found them to be very useful.
People tend to discredit his technical analysis when they learns about vibrations, time cycles, and other more esoteric matter, but the gann swing charting is definately something I think other people should consider. Gann technical analysis cán be more objective than regular.
Thanks Swing Trends for the article on gann swing charting. Objective analysis seems to be essential to begin a way to view a market in a consistent and repeatable manner. I found you article informative and useful.
Thanks
An excellent presentation. Where has this technician been hiding? We need to see more of his work. Gus