
I see analysis popping up out there refuting the bearish Descending Triangle view and in my opinion that is with good reason; it looks a lot more like a massive consolidation of previous bullishness than a topping pattern.
However, a common theme seems to be some kind of static about a QE3 'Super Sunday' (don't hold your breath) or some such noise and gold's imminent and preordained blast off, never to return to current levels as the 'banksters' take it higher and higher.
A theme seems to be that now is the time to be bullish but I have also read within the same theme that we cannot be sure that the 'banksters' will not crash gold through support first, to totally eliminate the little guy before bringing it higher.
This blog noted that possibility last week. As in my 'guess' (and that's all any of these guys are doing) was that gold would break down, potentially to the high 1400's, where it may end its correction on a final shake out.
I will tell you what should be eliminated however, and it is not so much the little guy as it is the grand and titillating predictions. There is stuff out there that has been strongly supportive of gold and gold stocks all the way down, while always containing a rejoinder like 'of course it can go lower so the gold community can get 99% eliminated before the 'banksters' (or whatever the nickname du jour is) ramp it higher'.
A problem being that this dynamic sounding analysis has kept 'em in it every step of the way down - and managed to cover its own a$$ at the same time by always slipping in a caveat. The suggestion here is to keep an open mind, realize that not you, me or the writers of dynamic and titillating things know what is going to happen.
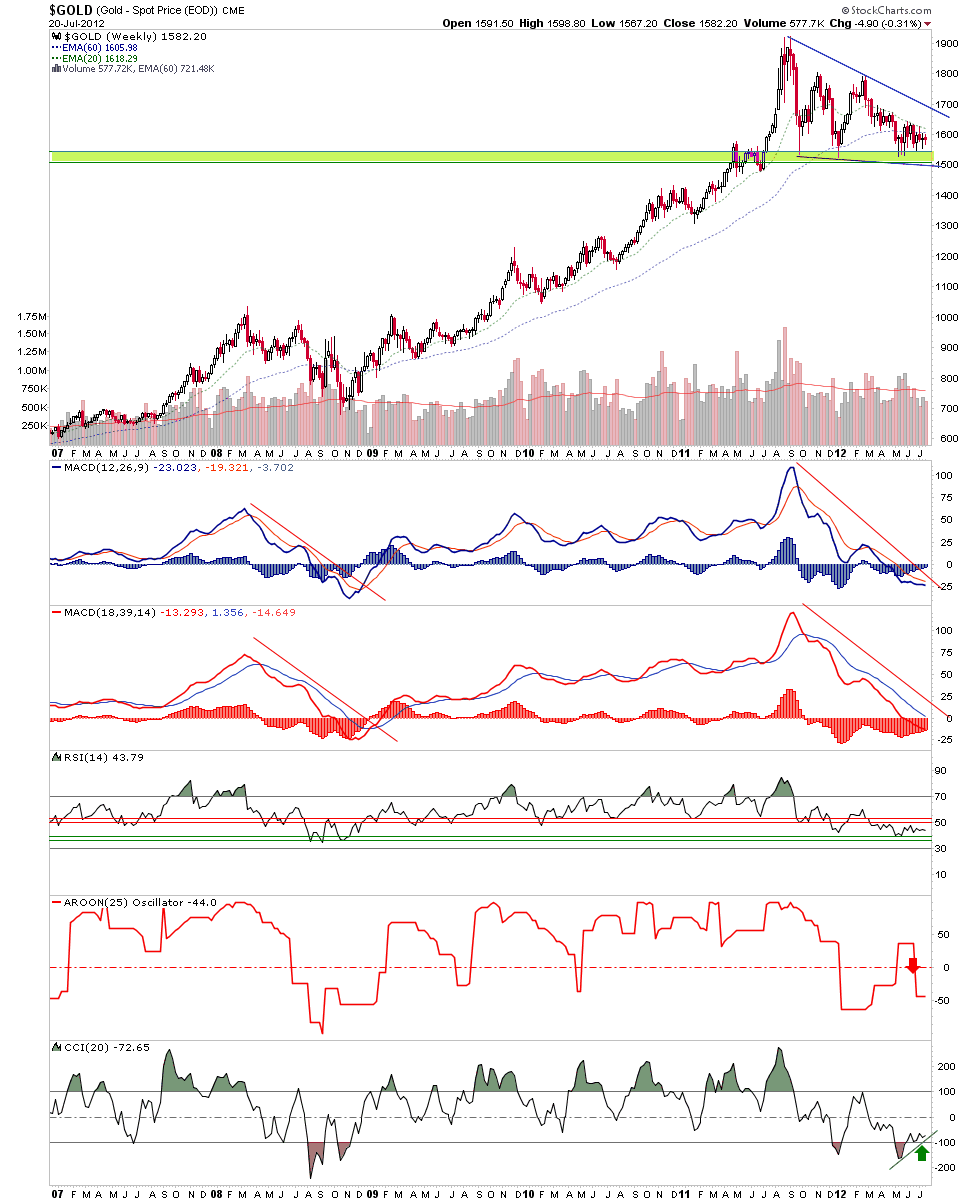
What I do know is that the chart above is very orderly. The weekly MACD and the altered and slower MACD I am experimenting with (in place of the TRIX for now) have given no bull signal but have given a view of the elimination of damaging momentum. RSI is above important support and beneath resistance that would signal the end of the correction if exceeded. The weekly trend is down (as is daily, with monthly trend up) and the more sensitive CCI is above -100, which is a positive signal.
That is all there is. A metal that has been historically tied to sound money systems is in a corrective
By Gary Tanashian
http://www.biiwii.blogspot.com
http://www.biiwii.com/analysis.htm
Ron Paul, in his book "The Case For Gold" said in 83. "With a gold standard the Fed could disappear. The banking industry would become an industry like any other, subject to the profit and loss test and given no guarranteed bailouts at taxpayer expense. The financial industry would be forced to surrender its love of socialism (for losses not gains) and become honest again. We would all start living within our means and thriving off private wealth rather than depending on the public sector to save us.
Trade with other nations would benifit. Protectionist wars rooted in currency manipulation would cease. Policy options in Washington would be mercifully restricted to only what Washington could afford to do and and to enforce. Vast swaths of the public sector as we know it would have to just pack up and go home. This would be the greatest blessing visited on this country in a century. But can you see why Washington isn't interested? It has nothing to do with disagreements over economic theory. It is all about who has power in society. Paper money gives power to tyrants. Sound money, that is gold, gives power to the people and and the free markets they control.
No regrets here about selling some of my gold @ $1750. I don't think there's any great hurry to buy or sell here.
I think if you draw the bottom line as a horizontal you get a textbook picture of a descending triangle formed at the top of the market. You also have falling moving averages, and almost any trendline you draw from a few years ago to the present has been broken decisively to the downside.
And one more thing. The market almost never does what most expect it to. I see a preponderance of very bullish forecasters telling me gold is about to rocket to new highs. I think they have to be taken out of the picture before this can happen, even assuming gold can go up in what looks to be a developing deflationary environment.
Record low 30 year bond interest rate. This is an indication of future inflation?
Andy
You said, "Record low 30 year bond interest rate. This is an indication of future inflation?" Don't forget, the bond market is an openly manipulated market. It's no secret. It's not a conjecture. It's not a conspiracy theory. The FED announced that is buying long bonds, hand over fist, to FORCE long rates down. Central Banks are doing all they can to goose monetary velocity too, if you're going to mention that monetary velocity is falling. It's a race to the bottom between the US dollar and the other major currencies. They're all printing like crazy, and the sh*t is eventually going to hit the fan in a big way. I'm not saying WHEN the collapse of confidence in fiat currencies will happen, but it will suddenly occur with a blinding fury.
The FED is dwarfed by the market as a whole. $550,000,000,000 in treasury securities trade EVERY day. The FED is buying $267 billion of 7 year or longer notes and bonds with the sale of short term notes or bills.
You really believe the purchase of $267 billion in notes and bonds over several months has THAT much of an impact on this market? To the point of driving rates down to where they are today?
Do you also belive the FED can singlehandedly create economic growth from the policies it pursues?
If you do I know about a certain bridge up in NYC....
Also, did you happen to notice the dollar crossed above 84 today? Highest close in two years. Doesn't look like much of a race to the bottom.
Andy
Andy