
Each week Lo ngleaftrading.com will be providing us a chart of the week as analyzed by a member of their team. We hope that you enjoy and learn from this new feature.
Weekly Gold Review (09-04-2012)
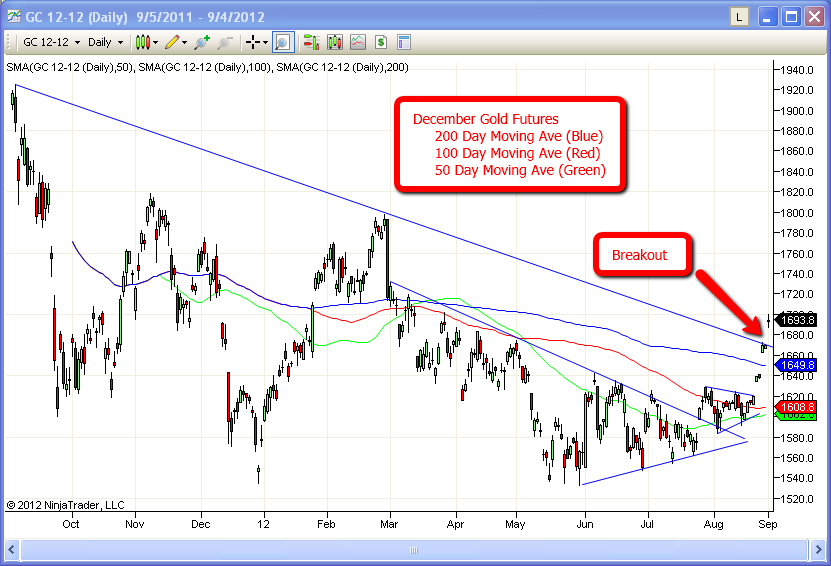
As anticipated, last week began with a choppy-to-lower trade in the Gold market after the prior week’s strength. It was expected that there would be an early hangover in the trade after Gold futures broke above the second wedge pattern (as seen on the chart provided) and awaited news from the Jackson Hole Symposium. While the last two years provided dependable, long term programs to base trades from (QE2 in 2010 and Operation Twist in 2011), this year was far less exciting.
Any trader that was involved in the markets last week, especially in the Precious Metals, has already read through Ben Bernanke’s speech, so there is no reason to repeat every word in this article. In short, there were no major changes in policy announced from Jackson Hole, but the FED continues to monitor the markets and stands ready to act if deemed necessary. Sound familiar?
This “middle of the road” announcement was somewhat expected as it seemed more likely that the United States would wait for this weeks policy statement from Europe before a final judgment would be made in the FOMC policy statement next week.
Traders are still unsure what Europe will bring to the table this week, if anything at all. Personally, I anticipate Europe will provide something that will be seen as supportive for the European Currency this week. It is difficult to predict what type of news to expect from their meeting, as the rules and processes for installing new policy in Europe is far more complicated than in the United States. But I believe that Europe understands the amount of negative impact their market has had globally, especially in the last six months. To be fair, things from a macro perspective have been ugly everywhere but Europe continues to drag the most from month to month. I believe that Europe’s “support” will involve the ECB purchasing Bonds and trying to somehow level the playing field for countries like Spain and Italy that continue to get drowned with higher borrowing costs. I expect that any announcement that provides support from the ECB will be seen as supportive for global markets, including Gold.
From a technical perspective, I will look for Gold to trade around $1700 (December Futures) for the early part of the week. If the trade continues to bid up, look for $1725 to be the next upside target. I would also expect that pullbacks would be bought around $1680, then around $1670 (see breakout on chart). If Gold closes below the trendline breakout price, the proverbial “line in the sand” should be the 200 day moving average around $1650. September has been a very supportive month over the last thirty years in Gold, so I do not expect this year to be any different.
Good luck this week in the markets. And please feel free to call or email my office. As a Senior Market Strategist with Long Leaf Trading, I advise customers in the futures markets and welcome any input from fellow traders. I can be reached toll free at (888) 272-6926 or by email at [email protected]
Thank you for your interest,
Brian Booth
Senior Market Strategist
888.272.6926
my think usa and, europe crises will be solve sell gold ,silver
Time to be ready to short gold as soon as hype dissipates. Too many newsletters/blogs/traders talking about this as a breakout, meaning it is most likely a fakeout.
Yes fundamentally it has to go up, but speculating short to intermediate term has nothing to do with fundamentals. If you are investing you may as well wait to buy lower at the fake out crash.
GOLD is a standard 'hedge' against inflation. 2012 is NO exception. We should continue to get bids around the world from the USA, India and China, as September is 'THE BUYING SEASON'. up, up and Away to 2000. dollars per ounce by 2013.