

Much to my dismay, I’ve never covered these hot indices in my posts. I detected some interesting chart patterns as well as significant price actions and thought if it might be interesting to cover and discuss.
These indices have a long trading history as well as great companies that are tracked by each index. The NYSE Arca Gold BUGS Index (HUI) and Philadelphia Gold and Silver Index (XAU) are the two most watched gold indices on the market. The main difference between them is that the HUI Index’s components are only gold producers (17 companies) whereas the XAU Index includes both gold and silver miners (30 names). Below is the table of listings for comparison.
Table 1. Current Composition of Indices
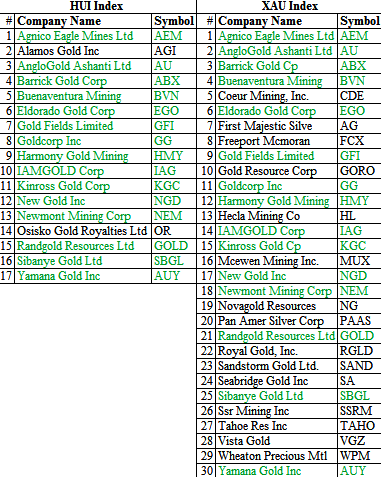
I highlighted the matching companies in green so you can easily see the difference between the indices. It is evident that the HUI index almost entirely sits in the XAU index (15 out of 17 names are in), the latter in its turn covers broader the precious metals market. Let us see in the charts below their dynamics and possible price action.
Chart 2. HUI Index Weekly: Testing Support Of Ascending Triangle
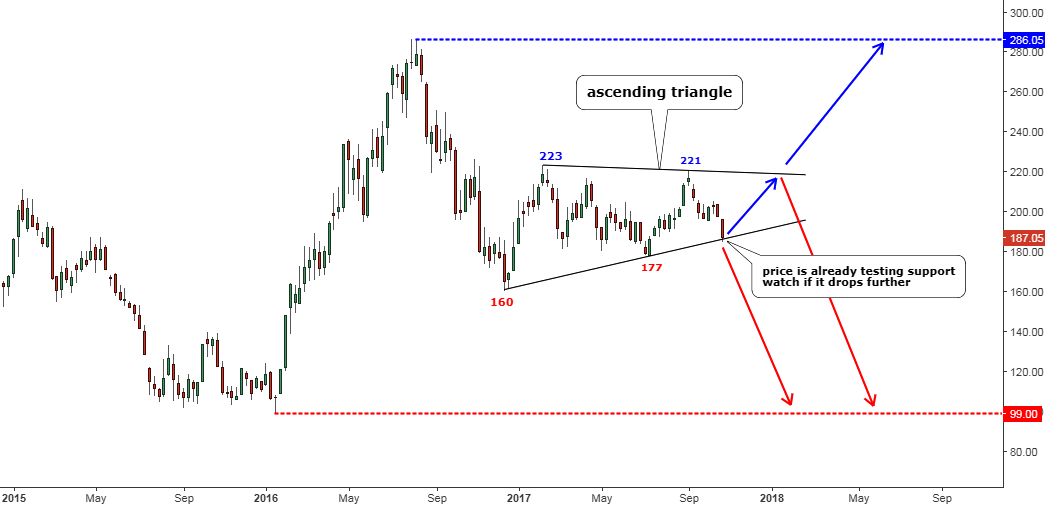
Chart courtesy of tradingview.com
The triangle is one of my favorite chart patterns as it clearly represents the consolidation. And most of the strong moves start after consolidation ends. It could be tricky as no one knows when the final breakout occurs and to which side. As you can see in the chart above, I highlighted possible price action directions in colored arrows.
The HUI Index plummeted quickly last week and is threatening to break out of the Ascending Triangle pattern, which was shaped during the recent consolidation. The price has already pierced the support, and further weakness could follow. The drop could hit much lower levels as this consolidation appeared after the huge price decline, which started last August from the multi-year peak ($218.05). The size of it could help us to suggest the depth of forthcoming weakness. Another slump could hit the remote area of previous major low at the $99 mark.
On the other hand, on Friday the price closed $2 higher than last Thursday. It could be a sign of the price rejection by the downside of the triangle. Then, the HUI index could try the upside of the triangle at the $220 area. There we should watch if the price will test it and break it or would just drop again. The breakup could lead to a previous major top area at the $286 mark.
I added price labels to the valleys and peaks of the triangle to highlight the important levels of immediate support and resistance. The invalidation of the triangle would come once the price cracks either the previous low at the $177 mark or the previous high at the $221 mark. And the final breakout of the current consolidation could be confirmed when the price breaks either below the $160 mark or above the $223 level.
Chart 3. XAU Index Weekly: Symmetric Triangle
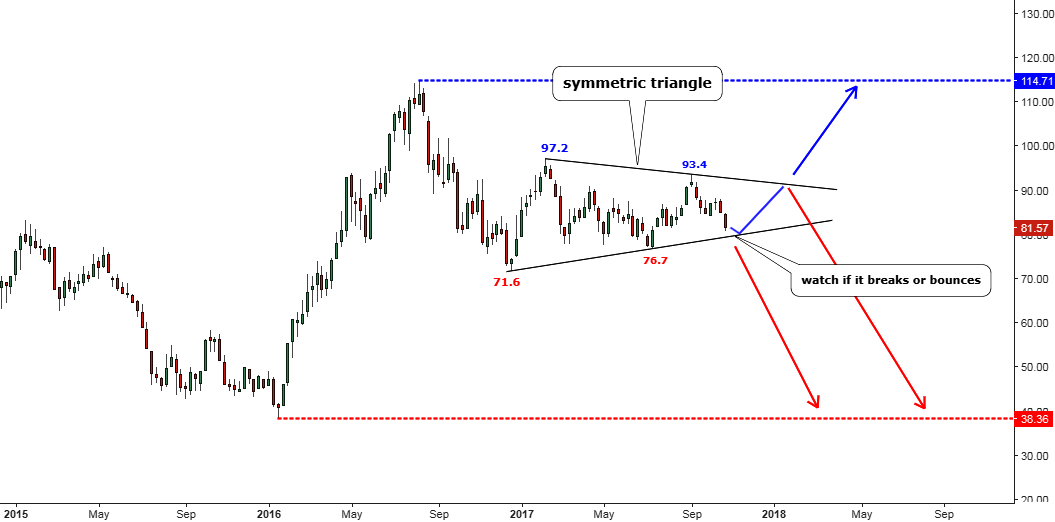
Chart courtesy of tradingview.com
We have a very beautiful Symmetric Triangle pattern on the XAU Index chart above. The price has yet to try to test the downside of the pattern here compared to the HUI Index where we have the crucial price action already. The possible price action directions are highlighted with the colored arrows.
It could take some time for the XAU Index to show itself. The drop from the previous major top here is less than in the HUI index - minus 29% vs. minus 35% respectively. Therefore, the downside target here is more distant than in the HUI Index. It looks like the silver producers inside of the XAU Index have softened the drop so far.
The price labels of the valleys and peaks of the triangle highlight important levels of immediate support and resistance. The invalidation of the triangle appears once the price breaks either the previous valley at the $76.7 mark or the previous peak at the $93.4 mark. The final breakout of the current consolidation would be confirmed when the price breaks either below the $71.6 mark or above the $97.2.
The downside target is located in the area of the previous major low at the $38.36 mark. The upside target is set at the previous major top at the $114.71 mark.
Intelligent trades!
Aibek Burabayev
INO.com Contributor, Metals