
Hello traders everywhere. Thursday's positive gains failed to follow through on Monday after the Easter weekend with a widespread sell-off taking hold and pushing all three indexes into correction territory.
Tech troubles and tariffs have pushed the S&P 500 through the 200-day moving average which viewed as a critical level of support. Technical traders and chartist alike believe that this breach can foreshadow even more significant declines down the road.
Now let's talk about the word correction. A correction is defined as "a reverse movement, usually negative, of at least 10% in a stock, bond, commodity or index to adjust for an overvaluation".
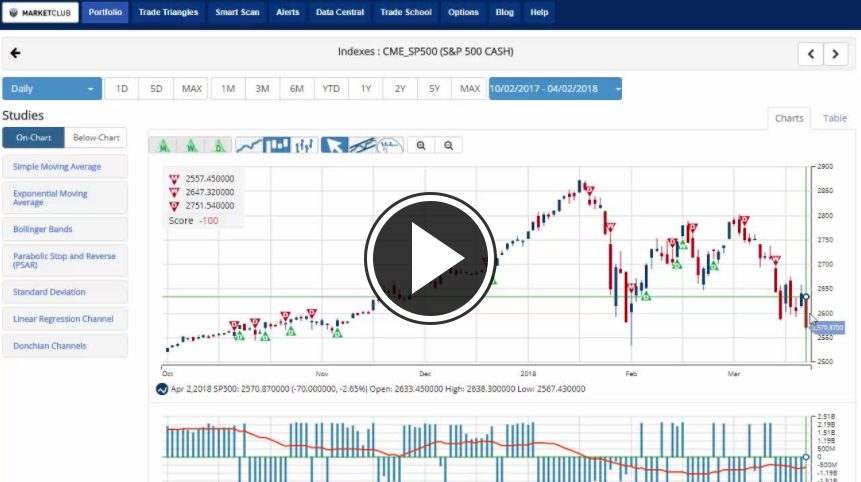
With that in mind, all three major indexes have dipped and flirted with correction territory today. At their lows of the day the S&P 500 was down 10.5%, The DOW was down 11.6%, and the NASDAQ was down 10.2% putting all three indexes in correction territory. Only the NASDAQ has been able to rebound, but it's still incredibly close to closing the day in a correction.
A key level to watch for the NASDAQ is 6,630.67, at that level our Trade Triangle technology will trigger a new red monthly Trade Triangle indicating that short position may be in order for the NASDAQ.
A critical level to watch for the DOW is 23,360.26, at that level our Trade Triangle technology will trigger a new red monthly Trade Triangle indicating that short position may be in order for the NASDAQ.
If that happens, all three indexes will have red monthly Trade Triangles. That can be used as an indication that we are headed for a more profound correction.
Key Levels To Watch This Week:
S&P 500 (CME:SP500): 2,801.90
Dow (INDEX:DJI): 23,360.29
NASDAQ (NASDAQ:COMP): 6,630.67
Gold (NYMEX:GC.M18.E): 1,347.30
Crude Oil (NYMEX:CL.K18.E): 62.95
U.S. Dollar (NYBOT:DX.M18.E): 89.98
Bitcoin (CME:BRTI): 6,194.46
Every Success,
Jeremy Lutz
INO.com and MarketClub.com