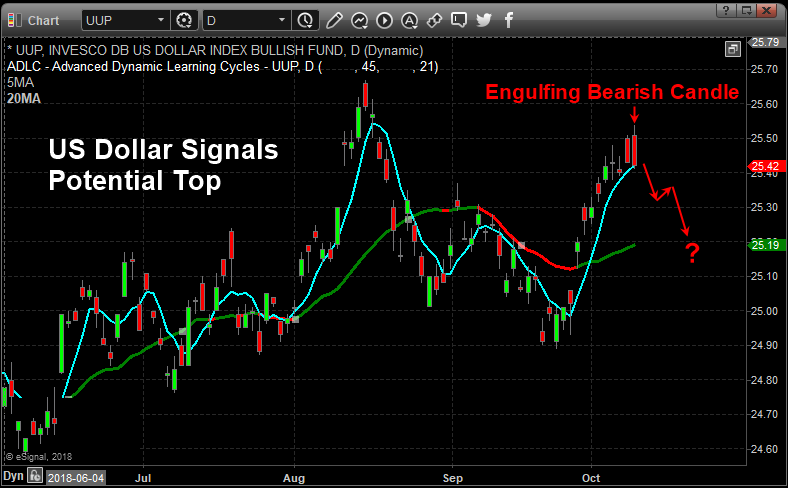
A unique setup has occurred in the Invesco DB US Dollar Index (UUP) that resembles an Engulfing Bearish type of pattern (even though it is not technically an Engulfing Bearish pattern). Technically, an Engulfing Bearish pattern should consist of a green candle followed by a larger red candle whereas the red candle’s body (the open to close range) completely engulfs the previous candle’s body. In the instance, we are highlighting in this article, a unique variation of what we’ll call a “Completely Filled Engulfing Bearish” pattern is setting up.
This is when two red candles set up in an Engulfing Bearish type of formation – omitting the requirement that the first candle is green. Japanese Candlesticks help us to identify the psychology of the market price in relation to our other specialized tools. We believe this formation is important because both of the red candlesticks that make up this pattern opened much higher than the previous bar’s close and dramatically sold off into the close of each session. We believe this type of rotation clearly illustrated that price is reaching resistance near $25.50 and pushing lower because of this strong resistance. We also believe this resistance/pattern will set up a downside price move in the US Dollar very soon.

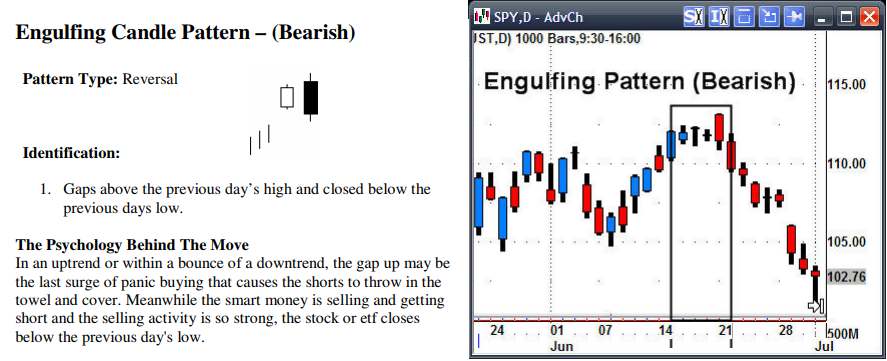
Below, we have highlighted the traditional formation of an Engulfing Bearish Candlestick pattern. The example chart, to the right of this definition, shows another variation of the Engulfing Bearish pattern setting up after three minor sideways candles. The interpretation of this Bearish Reversal pattern is subjective in terms of understanding the psychological representation of the Engulfing Bearish pattern. This pattern represents a total reversal of power within the price bar where the buyers were in control at the open (resulting in a higher opening price) and lost control through the trading session to allow the sellers to drive the price much lower into the close of the trading session. Thus, the Engulfing Bearish pattern represents a “key pivot point” in price that may prompt a larger downside move in the near future.

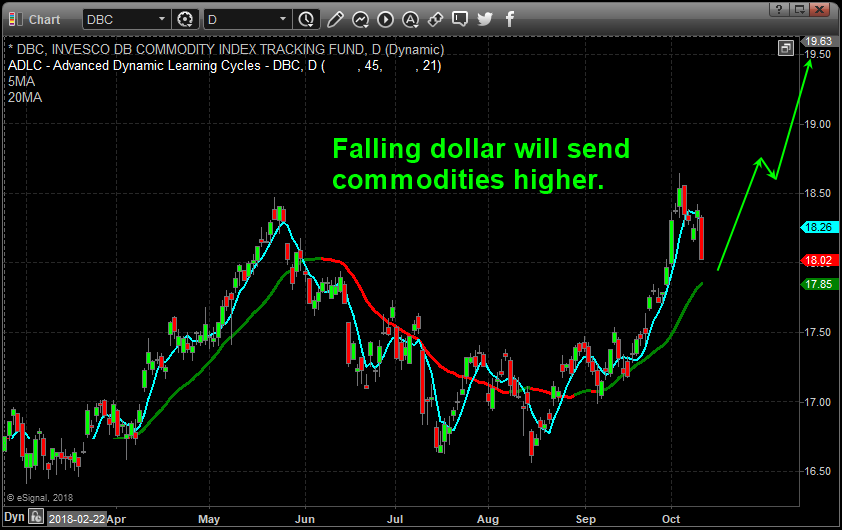
When we consider the totality of this US Dollar move, a falling US Dollar will result in a number of other relative price swings across almost all of the major global markets. One thing that is immediate for our research team is that any price decrease in the US Dollar will likely prompt a further advance in the price of Commodities. Commodities are tied to the US Dollar because almost all trade is based in UD Dollar value. When the US Dollar rises, commodities become more expensive for foreign buyers. When the US Dollar falls, commodities become less expensive for foreign buyers. Therefore, any price decline in the value of the US Dollar should prompt an increase in commodity prices.

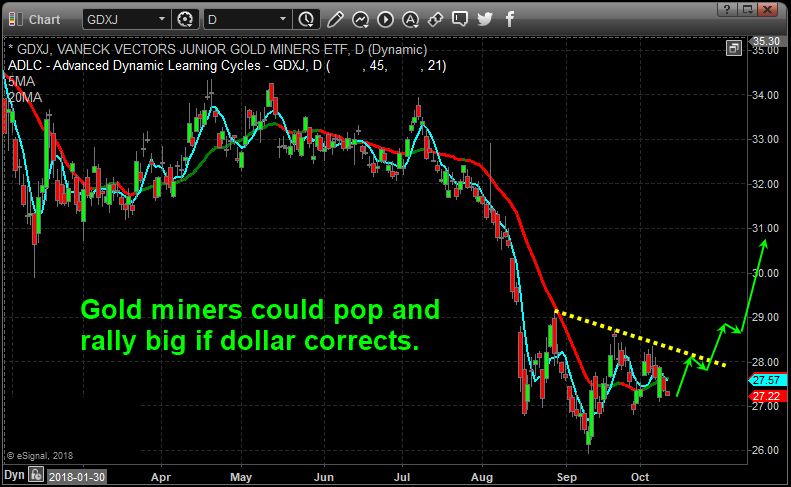
Additionally, any sharp decline in the price of the US Dollar should also prompt a rally in Precious Metals and Mining Stocks. Precious Metals react to US Dollar pricing just like Commodities do. As the US Dollar strengthens, Precious Metals tend to fall as a means to counter the increased cost basis for these metals. Under normal economic pressures, the precious metals react to pricing based on the fear of economic crisis events, raw demand, and global currency valuations. The few things that can dramatically alter this relationship are massive increases or decreases in demand and any type of global economic crisis events. When these impetus factor act together, the Precious Metals sector can rocket higher or decline quickly as the fear or demand issues increase and decrease over time.

Our belief is that the US Dollar will rotate lower over the next few weeks headed into the uncertainty of the US mid-term elections and that the Commodities and Precious Metals markets will likely increase in relation to this US Dollar weakness.
You don’t have to be smart to make money in the stock market, you just need to think differently. That means: we do not equate an “up” market with a “good” market and vice versa – all markets present opportunities to make money!
We believe you can always take what the market gives you, and make a CONSISTENT money.
Learn more by visiting The Technical Traders!
Chris Vermeulen
Technical Traders Ltd.
Disclosure: This article is the opinion of the contributor themselves. The above is a matter of opinion provided for general information purposes only and is not intended as investment advice. This contributor is not receiving compensation for their opinion.

In my 48 years of market studies;
I have seen a falling dollar lead to a massive commodity bull market.
For example:
In 1970 the dollar was unpegged from gold and floated on a mostly freely traded currency market.
Result: Commodities boomed higher for 10 years:
Housing, gold, silver, wheat, corn, and soybeans to name a few...
Gold in 1970 was $ 35 per oz. and
by early Jan. 1980 $ 850 per oz. (but not for long).
stupid question but how do you know this won't be a cup and saucer pattern?
Very helpful!