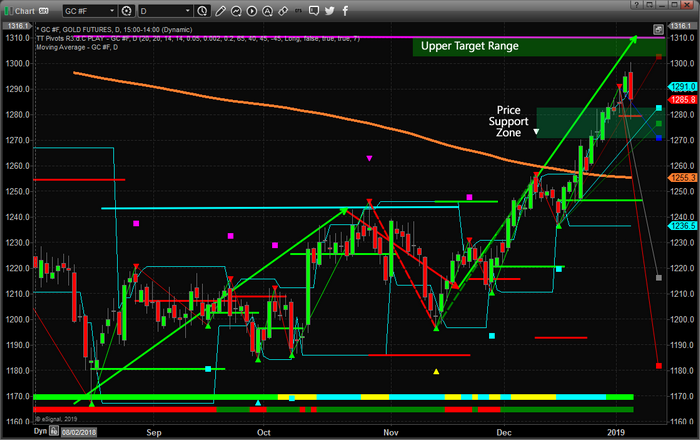
Early trading on January 4, 2019, saw Gold reach just above $1300 per ounce – confirming our price target from our research and posts on November 24, 2018. The importance of this move cannot be under-estimated. Traders and investors need to understand the recent rally in the metals markets are attempting to alert us that FEAR is starting to re-enter the market and that 2019 could start the year off with some extended volatility.
Our research has shown that Gold will likely rotate between $1270~1315 over the next 30~60 days before attempting to begin another rally. Our next upside price target is near $1500. We will continue to post articles to help everyone understand when and how this move will happen. We expect Gold to rotate near the $1300 level for at least another 30 days before attempting another price rally.
Pay attention to the Support Zone on this Daily Gold chart and understand that price rotation is very healthy for the metals markets at this point. A reprieve in this recent Gold rally would allow the start of 2019 to prompt a moderate rally in the US stock market as well as allow a continued capital shift to take place. As capital re-enters the global equities markets, investors will be seeking the best investment opportunities and safest environments for their capital. Our belief is that the US stock market will become the top-tier solution for many of these investments.

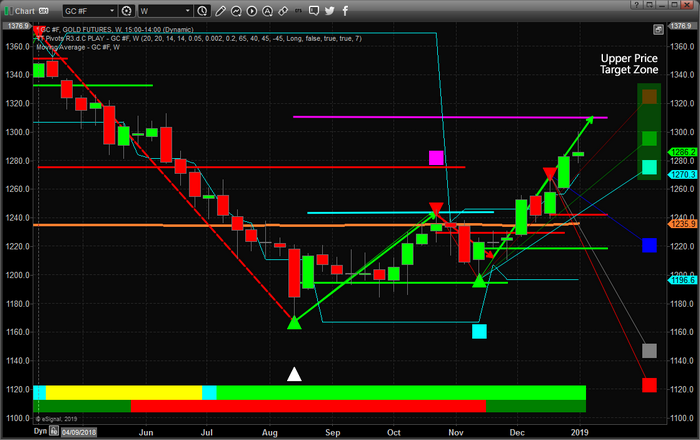
This Weekly Gold chart shows our Adaptive Fibonacci price modeling system and why price rotation is important at this time. The highlighted GREEN Fibonacci price target levels on the right side of this chart are projecting upside price objectives for the move that started near mid-November. We can see that $1325 (or so) is the highest target level and that $1273 to $1288 are the lower levels. This suggests that we have already reached the upper resistance range and a mild price rotation would allow for the price to establish a new fractal low rotation that would establish NEW upside Fibonacci price targets. In other words, we much have some price rotation to support the next leg higher in the Metals markets

You don’t have to be smart to make money in the stock market, you just need to think differently. That means: we do not equate an “up” market with a “good” market and vi versa – all markets present opportunities to make money!
We believe you can always take what the market gives you, and make a CONSISTENT money.
Learn more by visiting The Technical Traders!
Chris Vermeulen
Technical Traders Ltd.
Disclosure: This article is the opinion of the contributor themselves. The above is a matter of opinion provided for general information purposes only and is not intended as investment advice. This contributor is not receiving compensation for their opinion.

Micheal Oliver 's system shows Gold hits $1360 by end of January. Who is right Chris or Mike? Fun to watch.
buy....... slv
While reading technical analysis and looking back at previous posts one feels like laughing at what he has been reading and believing. I am in 60s and in this rut for over 25 years and truth is :
a. It is game of manipulation of influential financial institutions , selected analysts are fed the leads who predict the behavior of markets & stocks , the financial Institutions make moves accordingly confirming the technical analysis , common investor is lured in , higher projections with if & buts are published , suddenly the carpet is pulled out and the common man is ripped off .
Chris, I'm a retired broker who studied charts extensively. My Take:
The $usd winds it's way down to 94 and rallies up a bit to form a head and shoulders reversal pattern. Implications: Current gold rally continues for a bit, takes a reprieve while the second shoulder is formed, then really rallies as the $usd falls from 96(?) to 91.
Should that pattern develope, the second half of 2019 and all of 2020 should be "gangbusters" for gold. North of $1700/oz by the end of 2020?