
With more than 2,200 Exchange Traded Funds available to investors, fund managers are now finding that the lower they go in terms of fee’s, the more money they can attract. This isn’t a new idea as it was first spearheaded by the great late Jack Bogle, best known for his work at Vanguard and the man who is largely credited with the first index fund.
Bogle’s idea back then was that if he could get fund fee’s lower, he would be able to attract more money to the fund and therefore, in the long run, make more money for both his clients and his firm. Even decades after Jack changed the game for investment managers by slashing fee’s; Vanguard is still pushing the envelope on how low they can go. Recently the company filed regulatory documents showing that they were cutting the expense ratio on a number of ETFs; Vanguard Total Bond Market ETF BND (BND), Vanguard FTSE All-World ex-US VEU (VEU), Vanguard FTSE Europe ETF VGK (VGK), Vanguard FTSE Pacific ETF VPL (VPL), Vanguard Tax-Exempt Bond ETF VTEB (VTEB), Vanguard FTSE Emerging Markets ETF VWO (VWO) and Vanguard Total International Stock ETF VXUS (VXUS).
The move is the latest in what many have dubbed the ‘fee war’ which is taking place between fund managers. There is currently a handful of ETFs that have expense ratios as low as 0.03% two of which are managed by State Street Global Advisors and another two which are managed by Charles Schwab. There are three times as many ETFs with fees of 0.04%, and more than 150 with fees at or below 0.10%.
The largest ETF by assets under management, the SPDR S&P 500 ETF Trust (SPY), has an expense ratio of 0.09% and has over $262 billion in assets. But it would appear BlackRock’s iShares Core S&P 500 ETF (IVV) and some other low fee broad index ETFs could be gaining ground. Since the start of 2018 SPY has seen a negative net fund flow of $25.49 billion, while IVV has seen an increase of $12.1 billion. Vanguard’s S&P 500 ETF (VOO), which just like IVV has an expense ratio of 0.04% has seen positive fund flow of $15.92 billion since the start of 2018. Furthermore, another Vanguard ETF, the Vanguard Total Stock market ETF (VTI) which again boasts an expense ratio of 0.04% had $11.39 billion net positive flow during the same timeframe.
But despite the negative net fund flows for SPY, it still has a sizeable lead on the competition as its asset sit at $262 billion and the next closest the iShares Core S&P 500 ETF sitting at just $160 billion. Following behind that we have the Vanguard Total Stock Market Fund at $108 billion and then Vanguards S&P 500 ETF at $103 billion.
With that being said, another interesting data point is that while SPY, IVV, and VOO are all marketed as true S&P 500 ETFs, they don’t all produce the same returns as you can see in the table below.
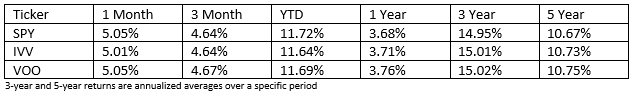
While in the short run some of the differences in prices can be attributed to a number of things such as when large redemptions were made or how much cash was on hand at specific times, the returns for the longer time periods of 1 year or greater can certainly be attributed to the higher or lower expense ratios.
Now you may be thinking that the difference between SPY’s 3.68% return and VOO’s 3.76% return is marginal when we look at the 5-year time frame, and VOO outpaced SPY by 0.08%. Again, this may seem trivial to you, but that 0.08% was for each of the five years and even that small amount can and will add up over the years, especially when you start considering how that 0.08% would compound over decades.
As more investors become aware of the lower fee competitors, we would have to imagine State Street will lower the expense ratio of the largest ETF by assets or it risks continuing to lose money to the other options available. And if you are currently invested in SPY, you may want to rethink where you have your money and if more bang for your buck, especially if you plan on leaving it to sit in one of those index funds and grow for decades to come.
Matt Thalman
INO.com Contributor - ETFs
Follow me on Twitter @mthalman5513
Disclosure: This contributor did not hold a position in any investment mentioned above at the time this blog post was published. This article is the opinion of the contributor themselves. The above is a matter of opinion provided for general information purposes only and is not intended as investment advice. This contributor is not receiving compensation (other than from INO.com) for their opinion.