Last Wednesday gold had hit the minimum target of $1490 that we were waiting for since January when the price was at $1288. The target was clear, but the path was not and only this May the market eliminated one of three possible options. One month later, it has finally shown its real face leaving the single initial path to go.
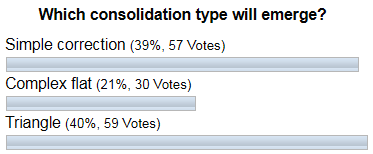
Last month gold advanced quite well, but it failed ahead of the first target. I spotted the consolidation on the 4-hour chart and shared it with you to reassure disappointed bullish traders as to when the price doesn’t reach the target someone could start to exit early. Consolidations are tricky by nature, and I showed you three possible types it could unfold. Let’s see below which one you liked the most.

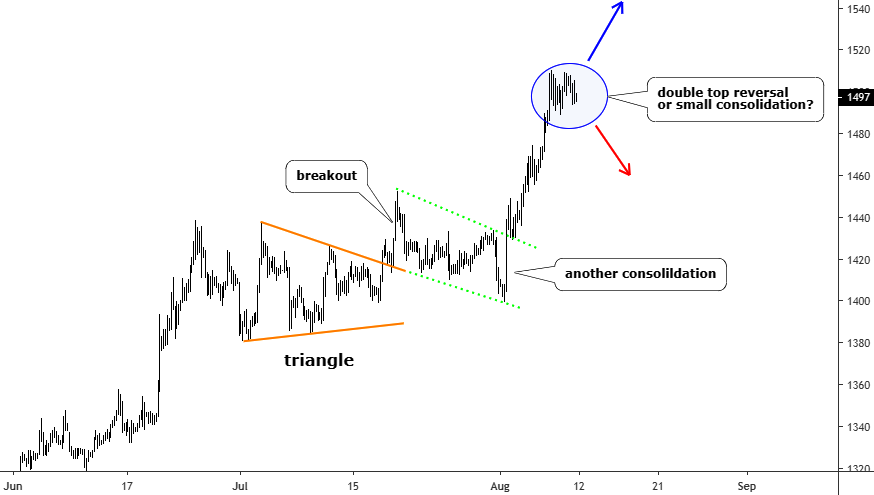
The triangular type was your first choice; the simple correction was the second with a minor gap, and the complex flat was the least liked. And again the majority of you were right as this was a triangle. Let’s see it in the updated 4-hourly chart below.

Chart courtesy of tradingview.com
The market sentiment was so bullish that the last zigzag within the triangle to the downside didn’t touch the lower bound of the figure. After that, we could see the clear breakout and the following classic pullback to the broken trendline. Then the market again has paused to think as the price couldn’t overcome the apex of breakout and dropped within another consolidation, which was contoured with the green trendlines. Interestingly, the lower green trendline is precisely the continuation of the upper orange trendline of the preceding triangle. That’s how the market sees it.
The next breakout during the first day of this month finally spurred enough buying demand to reach the target and even hit the round number handle of $1500. Now the market again charts the zigzags in a range of $1489-1510. Will it drop from here to retest the historical bottom of $1000 or will it continue further up to reach the next upside target? Not clear yet. In case of a reversal, we should wait for the drop to break below the preceding point of growth ($1400).
Let’s look at the bigger time frame to see what happens there.

Chart courtesy of tradingview.com
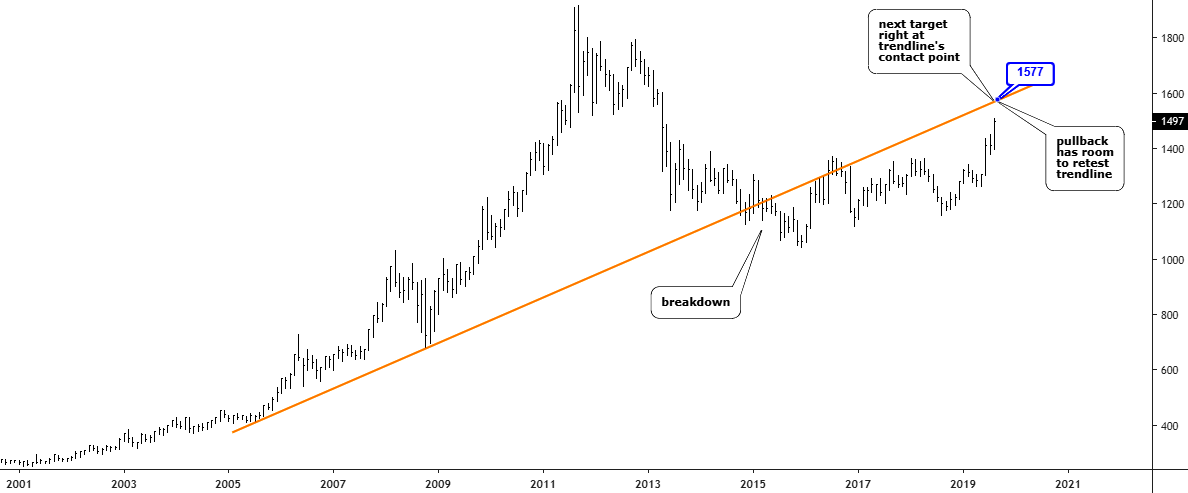
This time I kept it simple as I already had applied AB/CD projections and Fibonacci retracement levels, which correlated amazingly well. I used a classic trendline approach with one single orange trendline, which was built through valleys of 2005 and 2008. It was broken in 2015, and from that time there is a textbook pullback, which aims to retest the broken trendline before it continues in the direction of the breakdown.
You can see that we have an empty space for the current move up to touch the contact point of the broken trendline. And the next target of $1577 (1.272 of AB, 61.8% Fibonacci retracement) amazingly sitting right in the above-mentioned retest area. Therefore, the chances are good that we still can reach the target of our priority.
Intelligent trades!
Aibek Burabayev
INO.com Contributor, Metals
Disclosure: This contributor has no positions in any stocks mentioned in this article. This article is the opinion of the contributor themselves. The above is a matter of opinion provided for general information purposes only and is not intended as investment advice. This contributor is not receiving compensation (other than from INO.com) for their opinion.

The triangle shown in June/July time frame should be a five-wave move in Elliot wave terms, so the C point in your CD segment should be measured from the low point after July 15, roughly mid-range between the orange lines. Previous chart you showed had placed the C at the low point before July 15 which is incorrect in my opinion.
Thanks for the post!
Dave
Actually, on long-term triangle from 2016-2019 (another 5-wave triangle), C point should be placed at low on 5/2/19. AB and CD segments are shown on the long-term chart.
Thanks!
Dear Dave,
Thank you for active support and comments.
I understand your viewpoint for EW labeling on the long term chart. Thank you for sharing your thought.
Dear Dave,
I didn't apply the AB/CD segmentation to a 4-hour chart https://assets.ino.com/img/sites/ino/email/10729.jpg
And you are absolutely right with the EW approach labeling for the triangle to spot the bottom of it.
"The market sentiment was so bullish that the last zigzag within the triangle to the downside didn’t touch the lower bound of the figure."
Thank you for stopping by to share with all of us here at INO.com
Are the vote results ( I voted with the overwhelming majority) an indication that we are most likely wrong? 89 % awfully high consensus. I may fade next rally.
Love your posts Aibek, your insight is priceless. I always look forward to your Gold & Silver contributions. Every success in life should happen to you, thank you for always sharing your thoughts, and the audiences inclusion.
Dear Al,
There is such an idea that the majority always/often wrong, but it is an amazing miracle that the most of the time the majority is right here in my posts. As I said before, this could be the subject for some new behavioral science study :-).
I really appreciate your warm feedback. It inspires me to carry on sharing my thoughts and interact with the esteemed audience.
Ditto Al's thoughts and praise
Dear Don,
Thank you very much for a warm comment! God bless all of you!