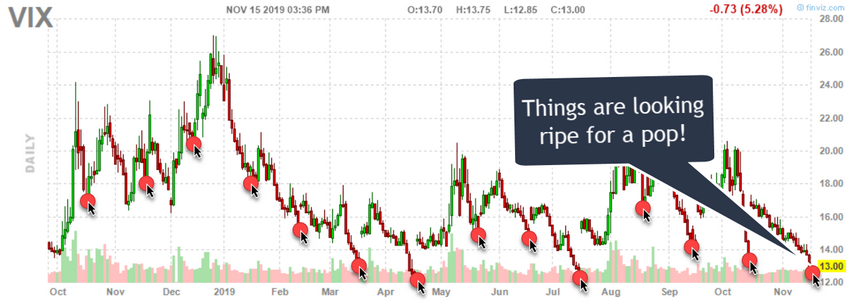
The VIX is warning that a market peak may be setting up in the global markets and that investors should be cautious of the extremely low price in the VIX. These extremely low prices in the VIX are typically followed by some type of increased volatility in the markets.
The US Federal Reserve continues to push an easy money policy and has recently begun acquiring more dept allowing a deeper move towards a Quantitative Easing stance. This move, along with investor confidence in the US markets, has prompted early warning signs that the market has reached near extreme levels/peaks.
VIX Value Drops Before Monthly Experation
When the VIX falls to levels below 12~13, this typically very low level is usually associated with an extreme peak in price. Throughout history, after the VIX has collapsed to these types of low price levels, the markets have a tendency to revert/correct in ranges that are typically in excess of 3.5% to 5.5%. In some cases, these corrections have been as large as 11% to 18% or more.
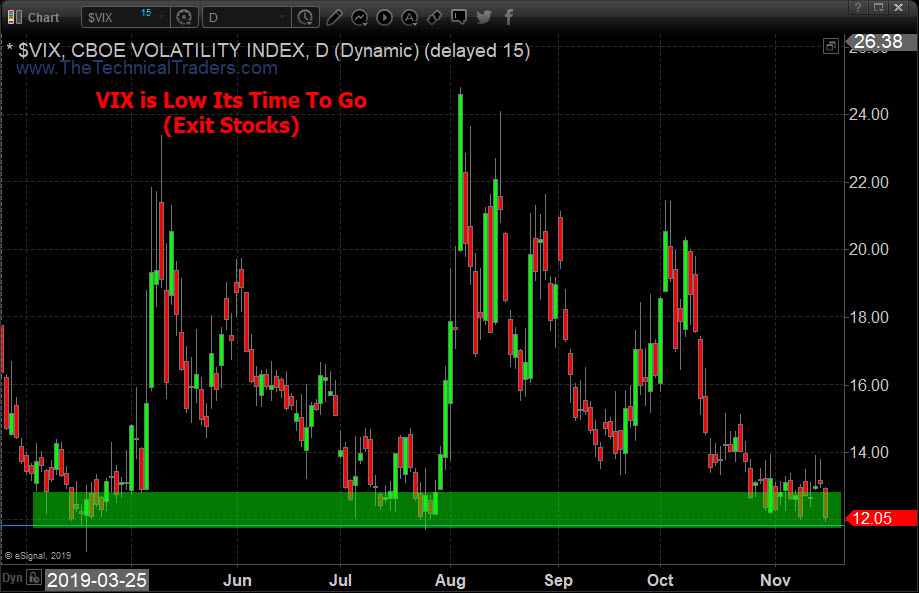
Current Continous VIX Price Chart
The current VIX level, near 12, is near the lowest historical levels of the past 12 months. Every time the VIX has fallen to near these levels, a peak in price has set up within just a few days potentially. Each time this setup has occurred, the price has rotated/corrected downward by at least 5.5%. Is that about to happen again in the US markets?
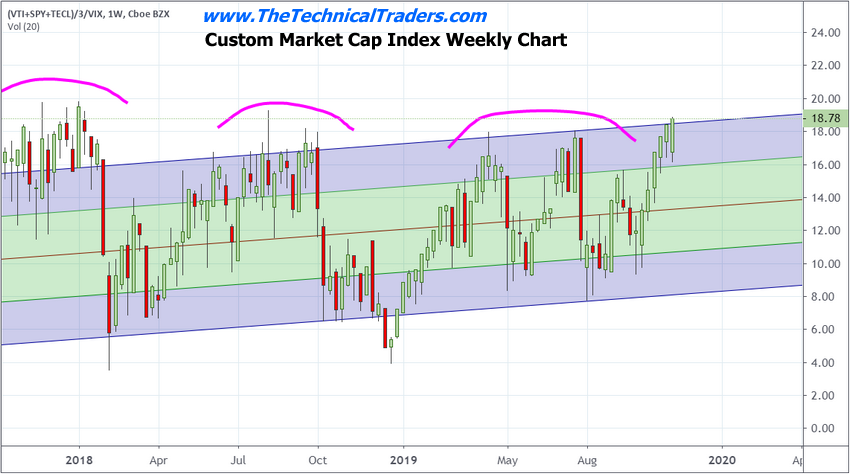
Custom Market Cap Index
Our custom Market Cap Index is also suggesting a market peak has setup and that price may likely revert to lower levels. Historically, when the price reaches these extreme price ranges, a rotation/reversion price event takes place. We believe a price reversion may be setting up in the US/Global markets that traders may not be prepared for. The current rally in the US stock market suggests a broader market rotation may take place. This suggests a deeper reversion event may be setting up.
Last week I talked about the 3-year record high outflows in the GLD gold bullion ETF and how it’s warning us that investors are not fearful of falling stock prices. This along with the VIX, and our custom index paint a clear contrarian signal that a top is near!
Concluding Thoughts
As we near the end of 2019, the current bullish price trend may come to a dramatic end as the VIX charts and our custom Index charts suggest the US/Global markets may have reached levels that support a price rotation/reversion event may be setting up. Traders need to be prepared for the risks associated with such an event and plan for extended risks.
You don’t have to be smart to make money in the stock market, you just need to think differently. That means: we do not equate an “up” market with a “good” market and vi versa – all markets present opportunities to make money!
We believe you can always take what the market gives you, and make a CONSISTENT money.
Learn more by visiting The Technical Traders!
Chris Vermeulen
Technical Traders Ltd.
Disclosure: This article is the opinion of the contributor themselves. The above is a matter of opinion provided for general information purposes only and is not intended as investment advice. This contributor is not receiving compensation for their opinion.


The VIX has a nice GAP at 17.5 and that is a sure Target.
most likely it will overshoot it into the 18,19,20 range.
where that will put the DOW Index ,I don't know , but it will be much
lower than 28,000
(2*)=128