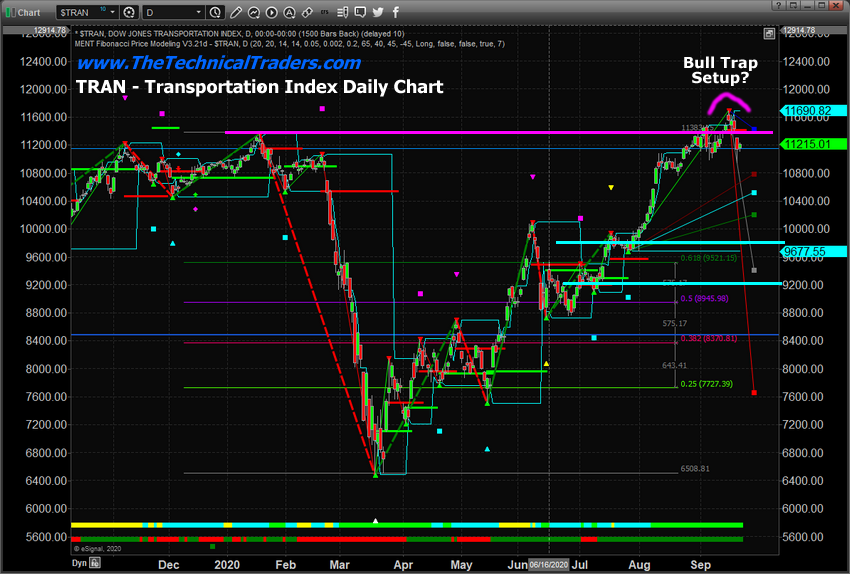
The Transportation Index, which typically leads the US stock market by 2 to 4+months, has been unusually aligned with the S&P 500 over the past 8+ months. Recently, though, the Transportation Index has rallied up to recent new all-time highs (over the past 9+ months) and has rotated lower – below resistance near 11,440 (the MAGENTA LINE on the first chart). Our researchers are warning us that any continued breakdown below this level could prompt a bigger downside market move.
Is recent rotation a topping pattern or just consolidation?
Currently, the US stock market has rolled into a sideways/topping pattern. After the peak in metals setup near August 7, 2020, the US stock market continued to rally a bit higher, then rotated lower on September 3, 2020. The Transportation Index rolled over on September 3 but climbed higher less than 5 trading days later – breaking above the highs set before the COVID-19 peak.
We’ve suggested a “Bull Trap” pattern may be forming in the major markets, and we’ve urged traders to be cautious regarding the new price highs and appearance of a continued upside price rally. The Bull Trap pattern, sometimes called a “Scouting Party,” happens when price breaks above resistance (or below support) briefly in an attempt to establish a new trend. If the price fails to find support after breaking above the previous resistance level, it typically rotates lower and collapses back below the resistance level (attempting to find a lower support level).
If our research is correct, the recent rotation in the Transportation Index may suggest a Bull Trap pattern has set up and completed (with the price falling back below the 11,440 level). If this trend continues, we may see a much bigger downside price move where price attempts to find support near 9,800 or 9,200.
This Daily Transportation Index chart highlights our proprietary Fibonacci Price Modeling system and the key resistance level near 11,440 (in MAGENTA). It also shows the Bull Trap set up near the recent highs. Past Fibonacci Price Trigger levels near 9,800 and 9,200 suggest any downside price move may target these levels as current support.

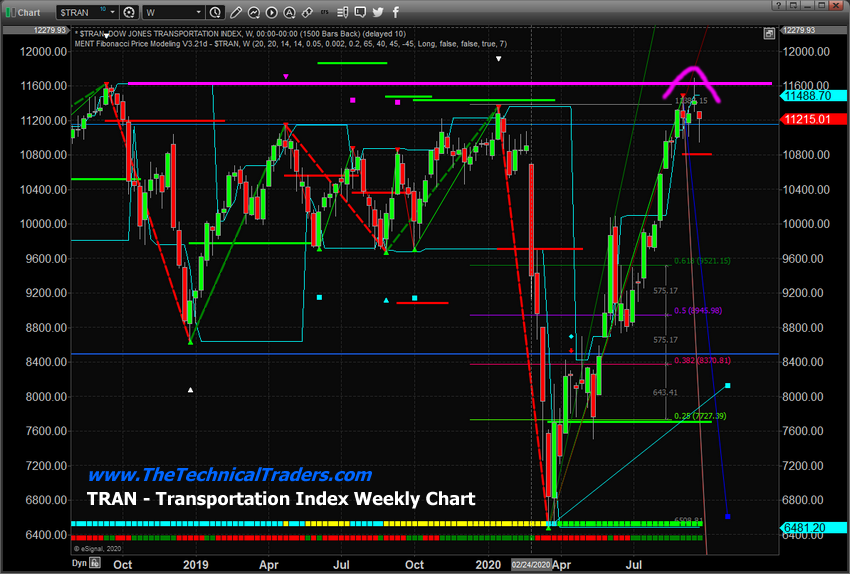
This Transportation Index Weekly chart provides a bigger picture look at the Bull Trap setup. The one aspect of the Weekly Transportation chart that we feel is critical is the 10,815 Bearish Price Trigger level from our Fibonacci Price Modeling System. This level is key to understanding if and when the Transportation Index breaks a major weekly Fibonacci trigger level. If the price falls below the 10,815 level and manages to close below this level on an end-of-week basis, then we have confirmation that the longer-term Fibonacci trigger level has confirmed a new bearish price trend. Right now, we don’t have that confirmation.
One other interesting pattern set up on the Weekly Transportation Index is the Three Rivers Evening Star topping pattern. This is a classic Japanese Candlestick top/sell reversal pattern. The term “three rivers” references the confluence of two rivers joining together (think of the strength and force of the water flow) to form a new “third river.” The descriptive name of the pattern is designed to illustrate the nuanced strength that lies behind this price setup. A three rivers pattern, once confirmed, is one of the more ominous topping patterns in the Japanese Candlestick price theory. It is usually associated with Doji and Hammer/Umbrella shaped price bars that are equally indicative of a price reversal.

In our past research, we authored a research article about Dow Theory and price trends that we believe should be reviewed by our friends and followers. It clearly describes the “Down Price Trend” theory, and our research team believes that recent weakness in the US stock market may prompt a new downside price trend.
At this time, we continue to urge our friends and followers to stay cautious of volatility and price rotation. The markets are in the process of rotating – certainly. The issue for all skilled technical traders right now is, “will it find support, or will it break down and start a new downside price trend?”. Our researchers believe we know what will happen; next we are just waiting for technical confirmation from price activity.
You don’t have to be smart to make money in the stock market; you need to think differently. That means: we do not equate an “up” market with a “good” market and vi versa – all markets present opportunities to make money!
We believe you can always take what the market gives you and make CONSISTENT money.
Learn more by visiting The Technical Traders!
Chris Vermeulen
Technical Traders Ltd.
Disclosure: This article is the opinion of the contributor themselves. The above is a matter of opinion provided for general information purposes only and is not intended as investment advice. This contributor is not receiving compensation for their opinion.

Oh... I was referring to the "Dark Cloud Cover" pattern on the SPY, 3Y, monthly that changed signals when you switched to Heikin-Ashi. I apologize for leaving that out.
This is a very interesting article. I have never traded using candlesticks. I looked up the pattern to learn something about it. I use Think or Swim trading platform and they give you a number of charting options. When I changed the chart from "candlestick" to "Heikin-Ashi candlestick" it actually changes the pattern to indicate a very strong uptrend. Using monthly data for three years, I see six "no shadow" green patterns.
I will add this, though. Reading your article has caused me to reevaluate one of the stocks I follow because using either system I'm showing a downtrend reversal. I'll go in tomorrow morning and buy some out-of-the-money puts for practically nothing, as the balance of traders of this particular equity are looking up, not down.
Thank you for adding to my trading knowledge. Well written.