Despite the major market crash in March, all of the major indexes ended 2020 in the green. The S&P 500 (SP500) ended the year up 26.89%, the Dow Jones Industrial Average (DJI) rose 18.73%, and the NASDAQ (COMP) increased by 21.39% in 2021. Despite what felt like a discount between technology stocks, the NASDAQ, and the market as a whole, the S&P 500, the technology-focused index, lagged the overall market.
While in 2020, it seems that no matter what you had invested in, you did well, 2021 was a bit different. 2021 was a little sector or momentum-driven as we saw the rise and fall of the meme stocks, the ever-fluctuating battle between the ‘stay at home’ stocks and the ‘re-opening trade’ stocks. So, depending on when you bought or sold stocks or funds, unfortunately, really dictated how well your portfolio did over the past year.
When you look back at the year now, did you match market returns, fall behind, or were you invested in stocks and ETFs that beat the averages? Let’s take a look at the top five best performing ETFs of 2021 in a number of different categories the average investor has to choose from.
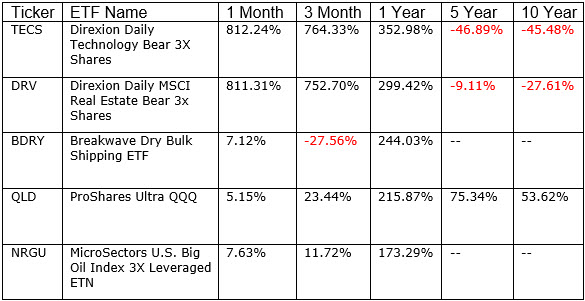
The following table shows the performance of the top five best performing ETFs in 2021, as well as their performance over the last month, the last three months, the last five and ten years.
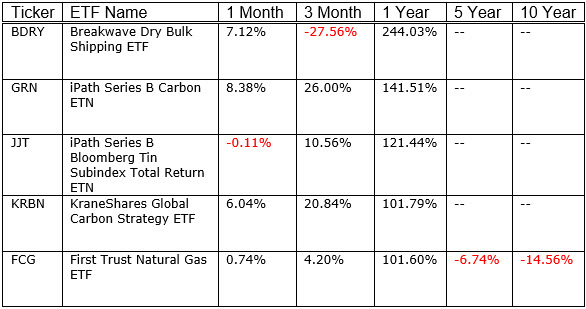
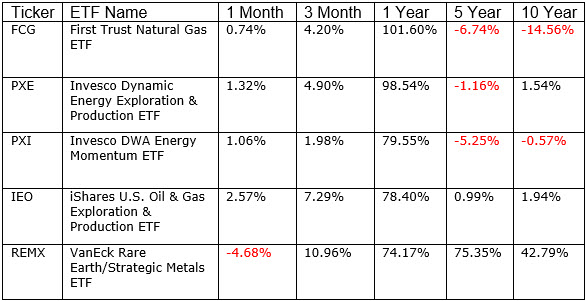
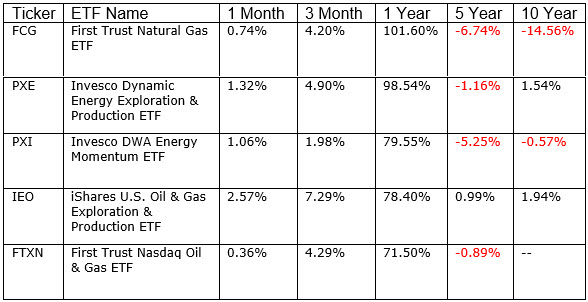
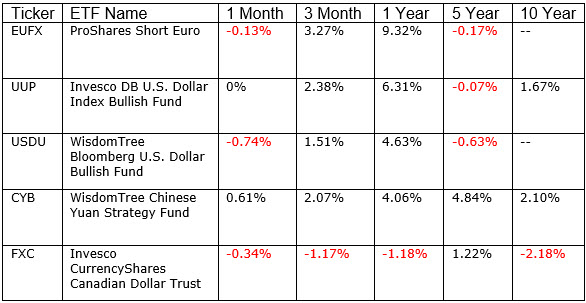
(All figures quoted are based on the December 31st, 2021 closing price. Five- and ten-year periods are annualized when available.)
The following table shows the performance of the top five Non-Leveraged ETFs in 2021 and their performance over the last month, the last three months, and the last five and ten years.
The following table shows the performance of the top five Equity Non-Leveraged ETFs in 2021 and their performance over the last month, the last three months, and the last five and ten years.
The following table shows the performance of the top five US Equity Non-Leveraged ETFs in 2021, as well as their performance over the last month, the last three months, the last five and ten years.
The following table shows the performance of the top five Global Ex-US Equity Non-Leveraged ETFs in 2021 and their performance over the last month, the last three months, and the last five and ten years.
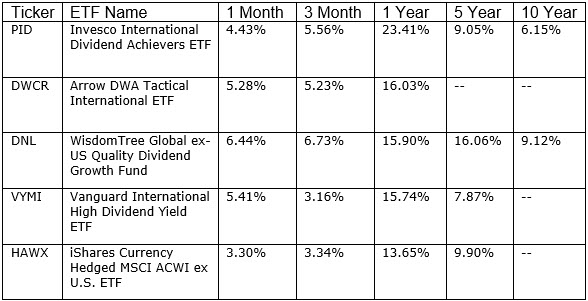
The following table shows the performance of the top five Developed Markets Equity Non-Leveraged ETFs in 2021, as well as their performance over the last month, the last three months, the last five and ten years.
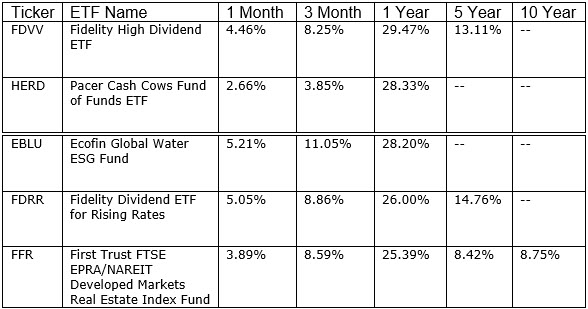
The following table shows the performance of the top five Emerging Markets Equity Non-Leveraged ETFs in 2021, as well as their performance over the last month, the last three months, the last five and ten years.
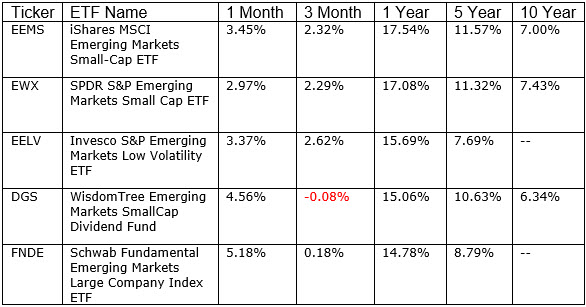
The following table shows the performance of the top five European Equity Non-Leveraged ETFs in 2021 and their performance over the last month, the last three months, and the last five and ten years.
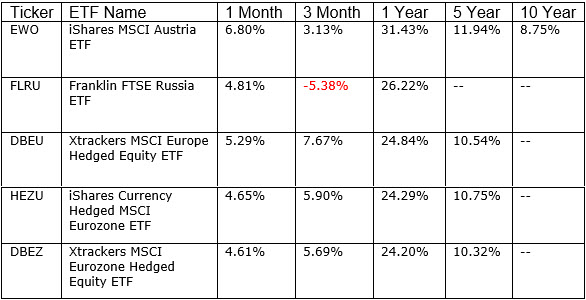
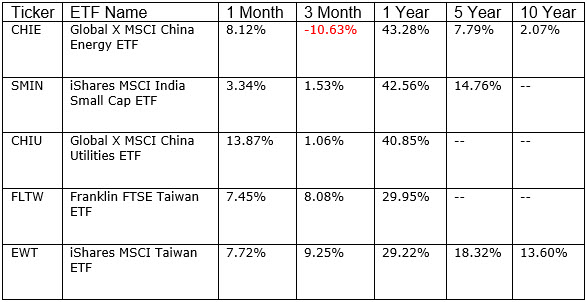
The following table shows the performance of the top five Asian-Pacific Equity Non-Leveraged ETFs in 2021, as well as their performance over the last month, the last three months, the last five and ten years.
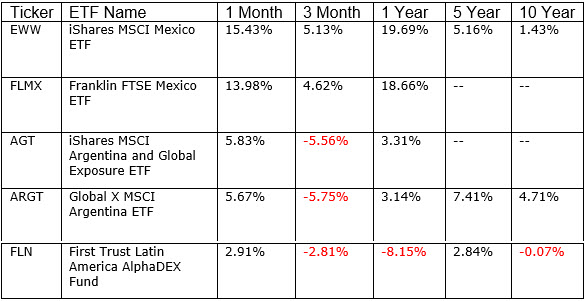
The following table shows the performance of the top five Latin American Equity Non-Leveraged ETFs in 2021 and their performance over the last month, the last three months, and the last five and ten years.
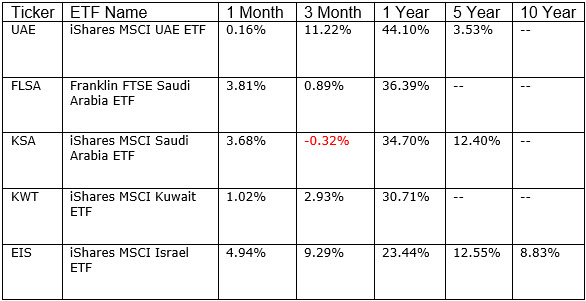
The following table shows the performance of the top five Middle-Eastern & African Equity Non-Leveraged ETFs in 2021 and their performance over the last month, the last three months, and the last five and ten years.
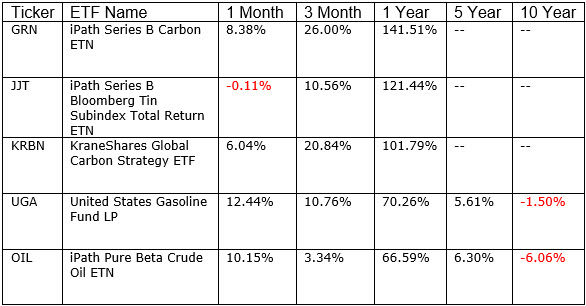
The following table shows the performance of the top five Commodity Non-Leveraged ETFs in 2021, as well as their performance over the last month, the last three months, the last five and ten years.
The following table shows the performance of the top five Currency Non-Leveraged ETFs in 2021 and their performance over the last month, the last three months, and the last five and ten years.
The following table shows the performance of the top five Fixed Income Non-Leveraged ETFs in 2021 and their performance over the last month, the last three months, and the last five and ten years.
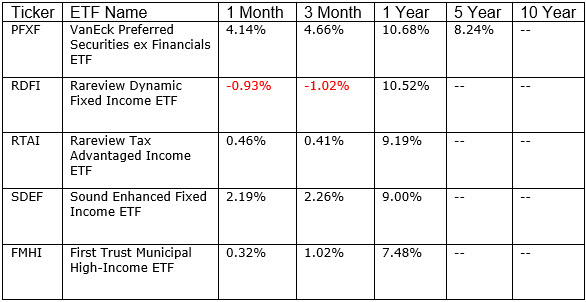
(All figures quoted above are based on the December 31st, 2021 closing price. Five and ten-year periods are annualized when available.)
As you can see from above, especially if you compare this year’s best performers list to previous years, what worked well in 2020 did not top the list in 2021. So Cathie Woods no longer seems untouchable, and while most of the FANG stocks gave investors positive returns in 2021, they didn’t crush the overall market like in years past.
Energy, commodities, and shipping topped this year’s list of best ETFs to own, which in hindsight shouldn’t have been too much of a surprise since they all had been beaten down in 2020 due to pandemic fears and restrictions.
As they say, hindsight is always 20/20, but instead of being disappointed that you may not have predicted what would outperform in 2021, use lists like the one above to help you figure out how you can become a better investor and have more foresight in the future. Look at what was occurring at the end of 2020 and why the companies and ETFs that outperformed did so, and then relate that information to our current situation to help you make informed decisions for the future based on your findings.
Best of luck to all investors in the new year!
Matt Thalman
INO.com Contributor - ETFs
Follow me on Twitter @mthalman5513
Disclosure: This contributor held long positions in Apple, Tesla, Intel, Google, Amazon.com, Facebook, Priceline and Microsoft at the time this blog post was published. This article is the opinion of the contributor themselves. The above is a matter of opinion provided for general information purposes only and is not intended as investment advice. This contributor is not receiving compensation (other than from INO.com) for their opinion.

Really good information and organized viewpoints too. Much appreciation to you for your work and analysis here.