This week we have a stock market forecast for the week of 1/2/2022 from our friend Bo Yoder of the Market Forecasting Academy. Be sure to leave a comment and let us know what you think!
The S&P 500 (SPY)
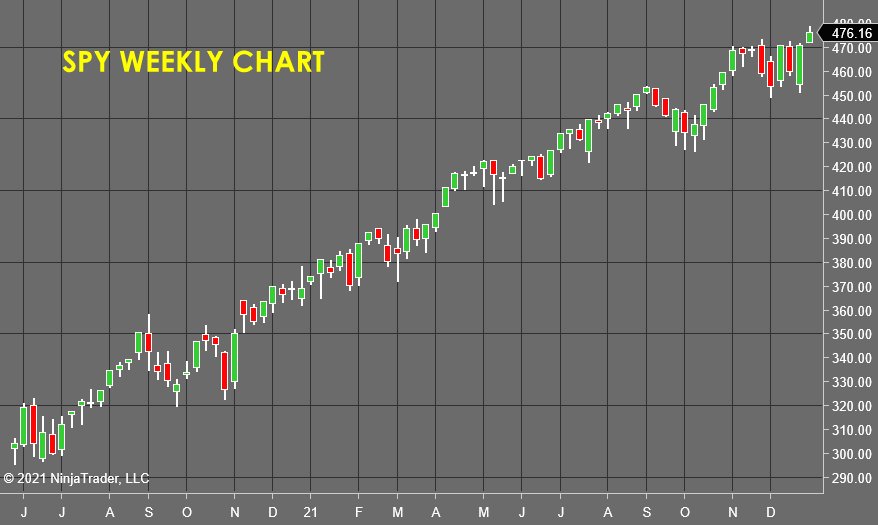
The Fed again interjected itself into the markets, and the downside follow through I was forecasting was squelched by the end of trading on Monday, then we flew back up to whipsaw out all the stops set above the highs! Since then, we sit and spin.
I still don't believe the breakout is sustainable and that we will turn lower. However, it may take a week or two to burn off the speed of the rally back up to the highs.
I'm not going to change any of my open trades, and this whipsaw reinforces my choice to take short exposure in the last forecast in individual stocks vs. the market index!
SPDR Gold Shares (GLD)
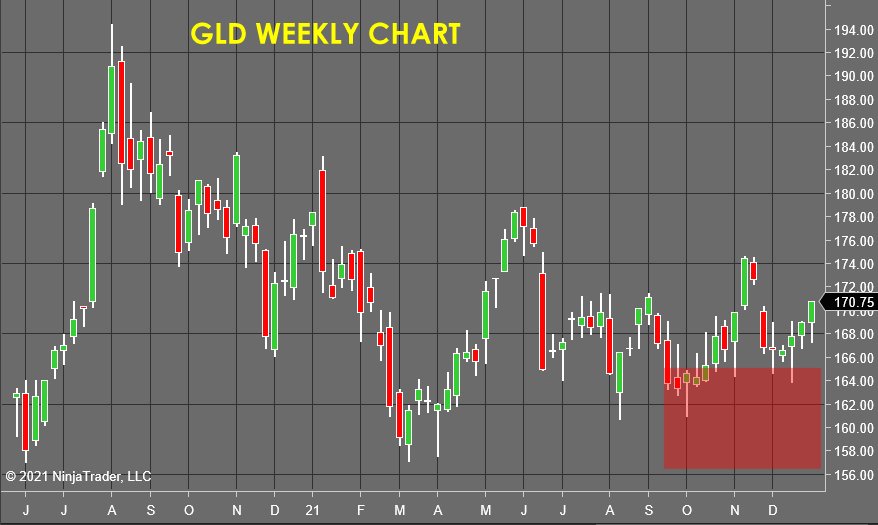
Gold continues to grind higher and ignores the volatility in the stock market. $175 will be the next significant test, and the odds are stacked in favor of a breakout and continued uptrend
iShares Silver Trust (SLV)
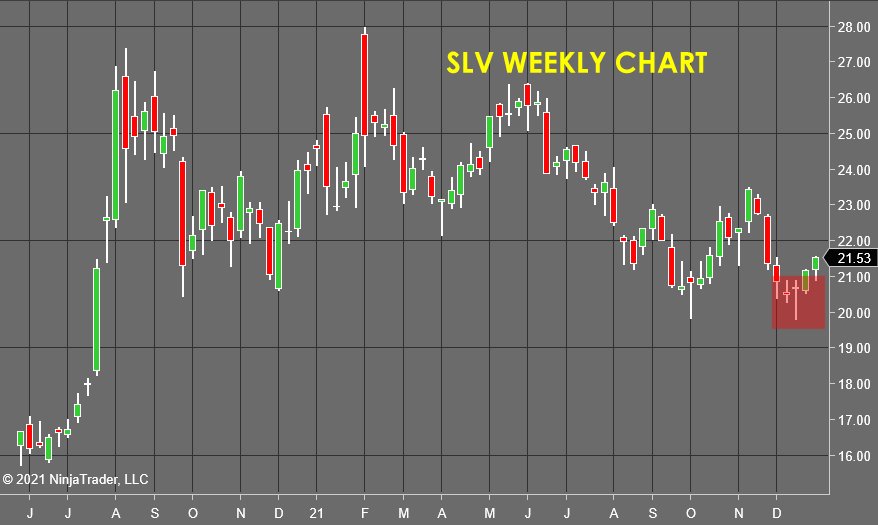
Silver mirrored gold and has been trending slowly and powerfully to the upside. I believe my entry was the best one, so now I sit tight with confidence as I wait for how this market chooses to deal with the $24 per share level.
Goldman Sachs (GS)
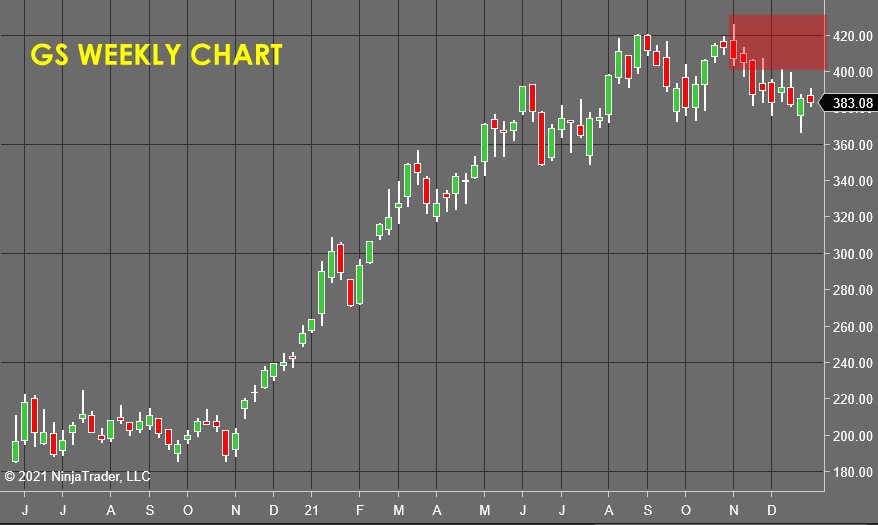
There was relative weakness here as the market indexes ping-ponged back to their highs, GS wasn't able to rally up to even take out the highs near $400. This week, we have turned back down, but it's critical that this stock take out the lows of two weeks ago. If it cannot pass this simple test, I will likely take profits.
Ulta Beauty, Inc. (ULTA)
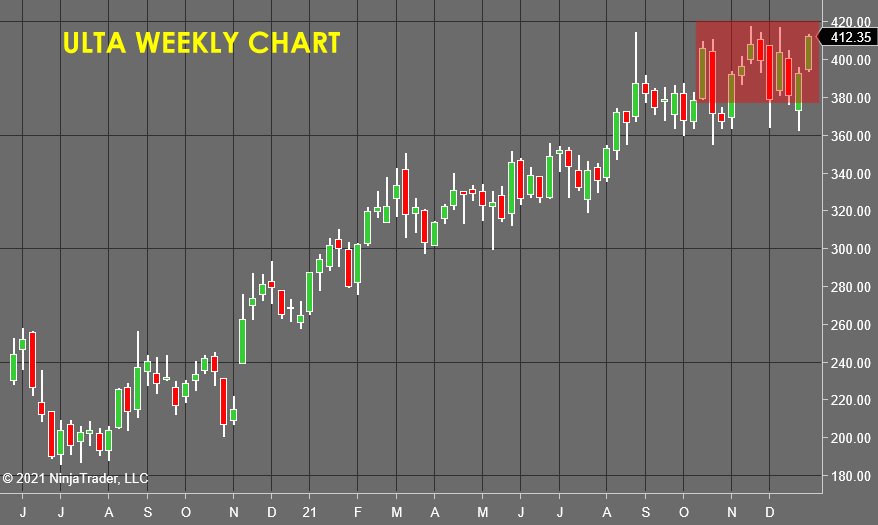
Bummer of a week from ULTA, as I was hoping this trade would be a classic example of how sometimes a trade can look bleak, then turn out happily after all. This may still happen, of course, but the odds are unfortunately high for a stop out above the red zone next week.
Voya Financial, Inc. (VOYA)
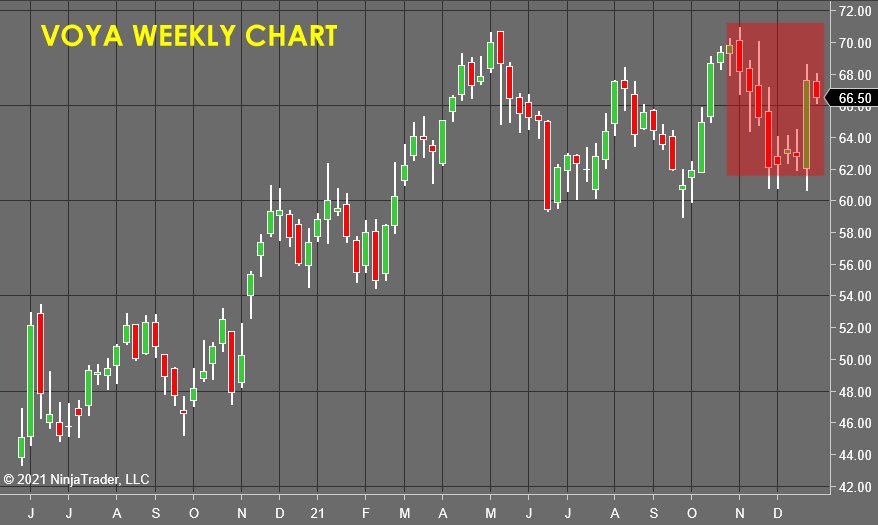
VOYA squeezed along with the rest of the market, then turned into a lower high. This reversal MUST produce a significant downside in next week's trading, or I risk being stuck in a channeling stock for months.
To Learn How To Accurately and Consistently Forecast Market Prices Just Like Me, Using Market Vulnerability Analysis™, visit Market Forecasting Academy for the Free 5 Day Market Forecasting Primer.
Check back to see my next post!
Bo Yoder
Market Forecasting Academy
About Bo Yoder:
Beginning his full-time trading career in 1997, Bo is a professional trader, partner at Market Forecasting Academy, developer of The Myalolipsis Technique, two-time author, and consultant to the financial industry on matters of market analysis and edge optimization.
Bo has been a featured speaker internationally for decades and has developed a reputation for trading live in front of an audience as a real-time example of what it is like to trade for a living.
In addition to his two books for McGraw-Hill, Mastering Futures Trading and Optimize Your Trading Edge (translated into German and Japanese), Bo has written articles published in top publications such as TheStreet.com, Technical Analysis of Stocks & Commodities, Trader's, Active Trader Magazine and Forbes to name a few.
Bo currently spends his time with his wife and son in the great state of Maine, where he trades, researches behavioral economics & neuropsychology, and is an enthusiastic sailboat racer.
He has an MBA from The Boston University School of Management.
Disclosure: This article is the opinion of the contributor themselves. The above is a matter of opinion provided for general information purposes only and is not intended as investment advice. This contributor is not receiving compensation for their opinion.

Thanks for sharing the information about weekly stock forecast.
I use $SPLV as an INDICATOR for $SPX -- and Friday Dec 31, 2021 -- made a NEW 52wk HIGH @ 68.86 -- I use $SPLV INSTEAD OF $VIX
anyhow -- I use 2 TD back = Thurs Dec 30, 2021 data to calculate for Mon Jan 3rd, 2022 targets.
C = 4778.73 √ +/ 0 0.325 | +/- 0.0625 = 4823.76 | = 4865.52 | = 4733.89 | =4692.70
O = 4794.23√ +/- 0.0325 | +/- 0.0625 = 4839.33 | = 4881.16 | = 4749.32 | 4708.06
H = 4808.93√ +/- 0.0325 | +/- 0.0625 = 4854.10 | = 4896.00 | = 4763.95 | 4722.63
L = 4775.33√ +/- 0.0325 | +/- 0.0625 = 4820.34 | = 4862.09 | = 4730.51 | 4689.33
also fiddle around w/ Fri Jan 31, 2021 CLOSE of (47)66.18 x 1.272 = 84.18 +/- 4766.18 = 4850.36 | 4682
can also use 47.66 x 1.272 = 60.62 +/- 4766.18 = 4826.80 | 4705.56
...this is Michael S. Jenkins' method of #experimenting with decimal points
PREVIOUS "TOPS"
Mon Nov 1 @ 4620.34 | Tues Nov 2 @ 4635.15 | Wed Nov 3 @ 4663.46 | Thurs Nov 4 @ 4683 | Fri Nov 5 @ 4718.50
Mon Dec 27 @ 4791.49 | Tues Dec 28 @ 4807.02 | Thurs Dec 30 @ 4808.93|
there are many other methods used. astrology, etc
Have you calculated your average accuracy and risk to reward factor for this analysis?
This work will let you quantify your edge which opens up a lot of comparison and optimization possibilities!
I did a lesson on this (Among many) which you might find useful...
It's available here:
https://www.reddit.com/r/tradingfundamentals/comments/pkzz2e/whats_the_margin_of_your_trading_business/
Are these stocks that we should trade this week?
Are these charts forecast for this upcoming week?
Hi Deen!!
Each forecast is looking at the week ahead. If the forecast odds are high enough I'll define an area of trading operations. That's what the colored boxes are for...any prices within the box is considered a chance to buy or short. If the opposite side of the zone is violated, the forecast has failed and stop losses should be taken.