I have to admit: About halfway through last month, I was sitting in my car waiting for gas at the local grocery store and I had a gut-wrenching feeling.
My prediction about inflation peaking in April at an 8.3% annual rate might be wrong.
Dead wrong.
So as I sat their waiting for my turn, staring at gas close to $5 a gallon, I had to face the facts that energy costs are simply not moderating as quickly as I had hoped. And without having to do a deep dive right there into the data, I knew that that these stubborn gas prices were enough to blow my hopes of inflation moderating in May.
Fast forward a couple of weeks to just a few days ago when the latest inflation numbers hit the street. Fact is I don’t have to tell you that my mid-May revelation about inflation turned out to be true.
Inflation is on a Tear
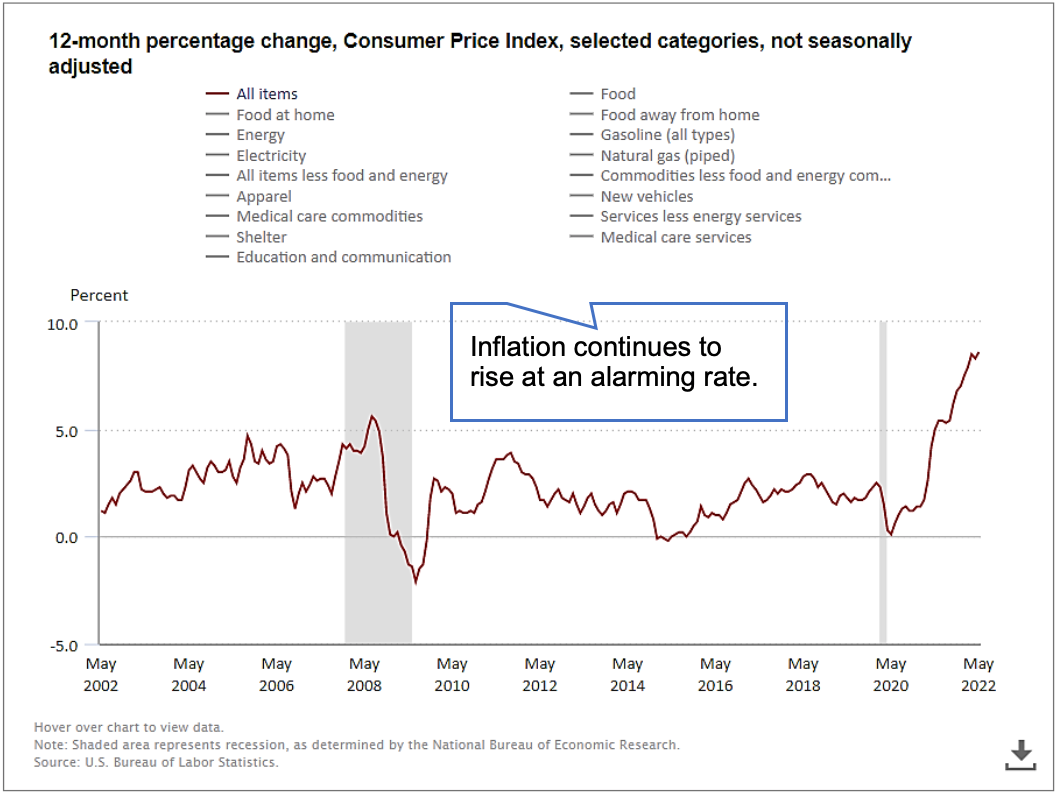
During May inflation rose at a mind-boggling 8.6% annual rate. That marks the fastest pace of rising prices since December 1981, over four decades ago. See for yourself:
As you can see from this chart of annual changes in consumer prices, the story of high inflation continued unabated in May. And across the board, every category of prices showed increases: Food was up a 10% annual rate in May, energy was up 35%, and all types of gasoline rose a staggering 49%.
49% rise in gas prices! Whew!
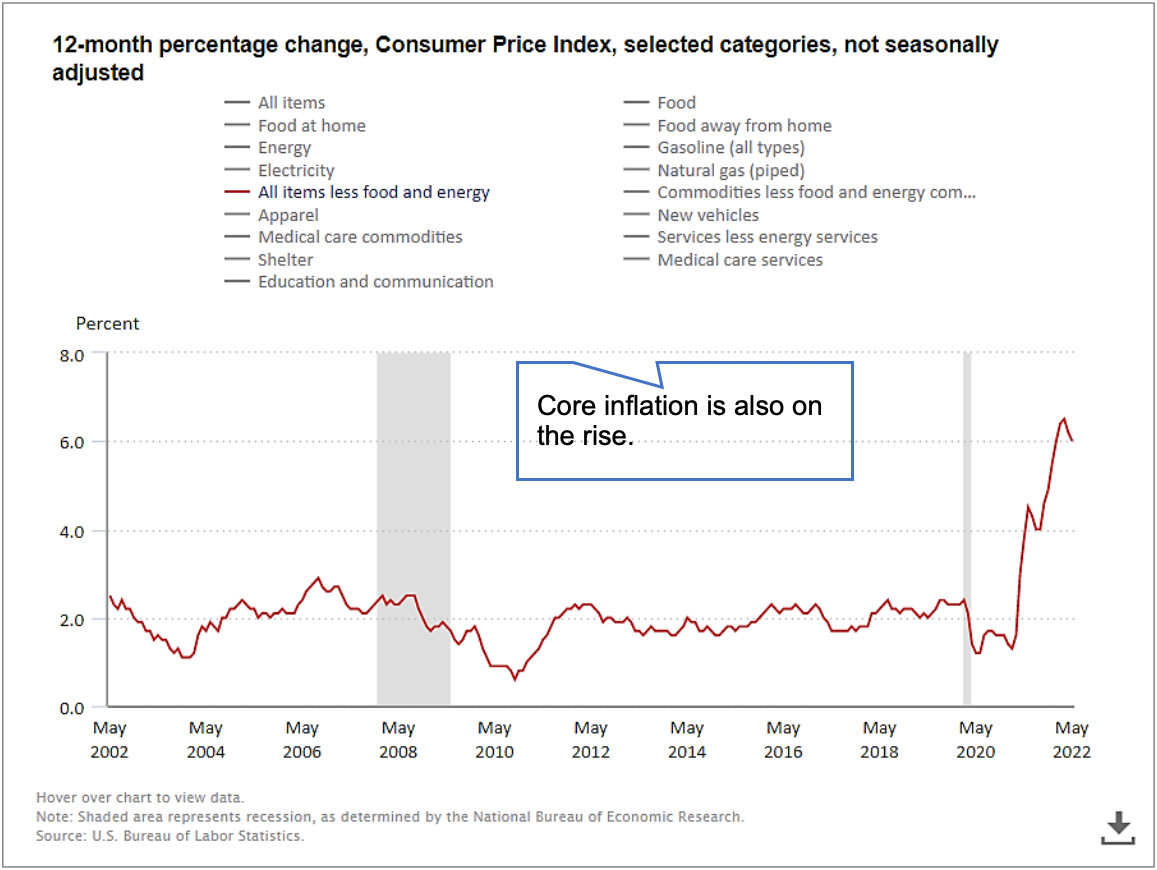
Now, if you strip out the more volatile food and energy prices and drill down into the so-called “core” inflation rate, the story isn’t much better: Core inflation rose at a 6% annual rate in May.
When core inflation rises, it’s a clear indicator that the rise in prices in broad and robust. The above chart clearly shows that that holds true in May.
But as I drilled even deeper into this data, I didn’t think that was the whole story. So, I decided to get into the nitty gritty behind these numbers and crunch some of my own analytics from the Bureau of Labor Statistics (BLS) raw data. (The Bureau of Labor Statistics is one of the two major sources of inflation data. The other is the Personal Consumption Expenditures index from the Bureau of Economic Analysis). This is what I came up with…
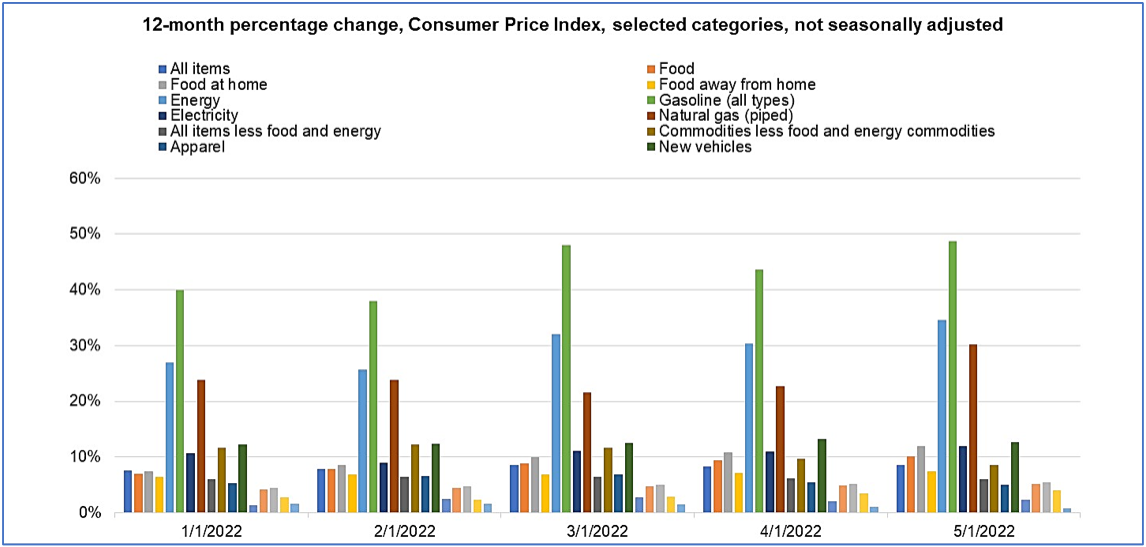
This chart shows the major price categories tracked by the BLS and what’s happened with their pricing activity since the beginning of the year. Think of it as the bigger brother to the prior off-the-shelf chart from BLS.
As you can see, the annual changes in every price category are at worrisome levels. And those annual increases have been in the works for months.
So, while the latest inflation numbers are troubling, fact is they are only the latest installment in a trend that’s been sticking around way too long. And that makes these inflation numbers a trend, another reason for concern.
What bar stands out for you from the above chart? Without a doubt, the dubious winner in higher prices since the beginning of the year is the green bar. And as you might guess that bar represents the annual increase in gasoline prices.
So, while the fact that gas shot up 49% in May compared to a year ago is bad enough, the above chart shows that gas has been clocking annual increases in the 40% area throughout 2022.
More Fed Handwringing Coming
No doubt about it, inflation is on a tear. And since the most recent numbers are showing that top line inflation shows little signs of slowing the Fed is likely to do a lot of handwringing.
In addition, with little doubt that analysts at the Fed, the Whitehouse, and the Bureau of Labor Statistics are doing the same analytics on the raw data that I did, they’re going to see that inflation is chronic across all pricing categories.
What does that mean? It means that the Fed is likely to be even more aggressive with raising interest rates in the future. They’re going to do pretty much anything in their power to try to extract liquidity from the market so people and businesses cool their spending and bring prices down. And if the stock market takes a hit in the process, well then so be it.
But don’t forget: While higher interest rates do work, they don’t function in isolation. The massive increase in gas prices is tied to the increase in the price of oil which is tied to the war in Ukraine, among other factors. So, until that conflict abates and oil prices begin to moderate, we’re not likely to see a ton of improvement in gas prices.
The super-tight labor market – which is a good thing for wages and workers – also tends to put pressure underneath prices. So, with not enough workers right now to fill job vacancies – and unemployment in the multi-decade low range – labor prices themselves are pushing prices higher.
What to do? For investors with holdings in just above every inflation sensitive asset – including crypto, stocks, bonds, and real estate - the best course of action is to continue to monitor what the Fed does and only add to positions that you feel are the most inflation resilient. Then just sit back and play the waiting game. And don’t forget: There’s no shame in being on the sidelines while these inflation forces continue to work themselves out of the economy.
Stay safe,
Wayne Burritt
INO.com Contributor
Disclosure: This contributor may own cryptocurrencies, stocks, or other assets mentioned in this article. This article is the opinion of the contributor themselves. The above is a matter of opinion provided for general information purposes only and is not intended as investment advice. This contributor is not receiving compensation (other than from INO.com) for their opinion.


If you think the war in Ukraine is affecting things, You should see what curtailing supply does; - This inflation started before the war in the Ukraine. - The doubling of my natural gas cost as a portion of my utilities has nothing to do with Ukraine, a lot more to do with the green initiative, supporting Putin's invasion and just plain not caring how many people suffer and yes, some will die eventually to support green. (If you don't believe that, wait 8 months.) - all that to jack up the price of oil to help finance the Russian invasion of the Ukraine and go green. If you don't think we're supporting the Russian invasion of Ukraine, just think about what turning on our oil taps would do to their ability to finance their war.
Looters around the world, most of them wearing fine Italian shoes, did quite well over the past two years as they dined on course after course of the finest central bank largesse. The dessert cart called “Ukraine aid” closed out the meal and now the world is left to deal with the aftermath of this spending orgy. I see it ending in massive debt write offs and deflation that will impoverish billions of people.