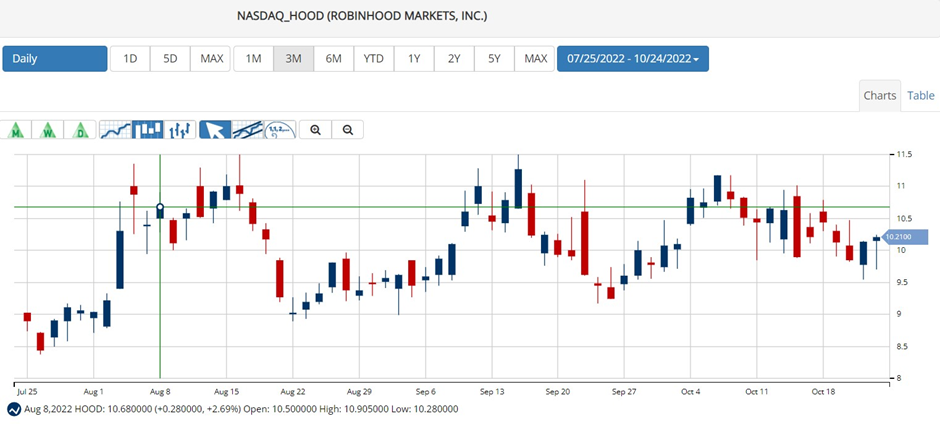
Shares of investing app operator Robinhood Markets, Inc. (HOOD) have declined more than 70% since its blockbuster IPO in July 2021. Moreover, the stock has declined 42.5% year-to-date.
Pioneering zero-commission trading, Robinhood's mobile app garnered huge popularity among beginners during the height of the COVID-19 pandemic. The company was at the center of the never-seen-before frenzied trading activity in meme stocks.
However, the retail brokerage controversially restricted trading in GameStop (GME) early last year, allowing investors to only sell their positions and not open new ones. This led to significant outrage among its users.
Since the Fed’s aggressive interest rate hikes have kept the market under pressure this year, most retail investors have stayed away from trading, leading to revenue loss for HOOD.
However, this rise in interest rates is turning out to be beneficial for brokerage firms like HOOD as customers tend to be more moderate in seeking out yield from their brokers when compared to banks.
Although cash sorting is one of the reasons banks have not risen in tandem with the rise in treasury yields, brokerages, on the other hand, are relatively in a better place as the request for cash sweeps among their customers is comparatively lower.
According to Curinos’s CDA Wealth data, during the previous cycle of rising interest rates between late 2015 and mid-2019, yields on wealth accounts under $250,000 subject to cash sweeps rose only 10% as much as the Federal funds rate. On the other hand, online savings accounts and one-year certificate-of-deposit rates rose 58% and 80%, respectively.
In addition, as brokers do not indulge in longer-term lending like banks, their assets tend to be shorter-term. This is beneficial, especially in a rising interest rate environment when cash can be redeployed at higher yields.
Wolfe Research had tracked mass-market brokerages in the last cycle of rising rates, where its net interest income tripled during that period, compared to the 25% gain across all Federal Deposit Insurance Corporation-insured banks.
Wolfe analyst Steven Chubak said, “Retail brokers are a cleaner play on rates right now.” HOOD is offering a 3% cash rate to some of its customers who are opting to pay for its Gold service leading to organic asset growth.
Although the stock market is down significantly this year due to the rising interest rates, HOOD’s stock has gained 8.2% in price over the past month and 12.4% over the past three months to close the last trading session at $10.21. It is trading above its 50-day moving average of $10.09.
In August, HOOD announced that it was undertaking organizational restructuring initiatives such as reducing the workforce and closing offices. After laying off 9% of its workforce in April, the company announced it was closing five more offices. It also said that it was laying off an additional 23% of its employees last month.
These restructuring initiatives are expected to result in annual run-rate savings of about $4 million per quarter between the final quarter of fiscal 2022 and the first quarter of fiscal 2024.
Here’s what could influence HOOD’s performance in the upcoming months:
Mixed Financials
HOOD’s total net revenues declined 43.7% year-over-year to $318 million for the second quarter that ended June 30, 2022. The company’s total operating expenses increased 21.7% year-over-year to $610 million.
Its adjusted EBITDA loss came in at $80 million, compared to an adjusted EBITDA of $90 million in the year-ago period. Its net loss narrowed 41.2% year-over-year to $295 million.
Mixed Profitability
Regarding the trailing-12-month gross profit margin, HOOD’s 61.60% is 3% lower than the 63.57% industry average. On the other hand, its 4.47% trailing-12-month Capex/Sales is 164.8% higher than the industry average of 1.69%.
Mixed Analyst Estimates
Analysts expect HOOD’s EPS for fiscal 2022 and 2023 to remain negative. Its revenue for fiscal 2022 is expected to decline 24% year-over-year to $1.38 billion.
However, the company’s revenue for fiscal 2023 is expected to increase 36.1% year-over-year to $1.88 billion.
Technical Indicators Show Promise
While HOOD may not look attractive from the fundamental point of view, it does show upward trends, which traders could capitalize on.
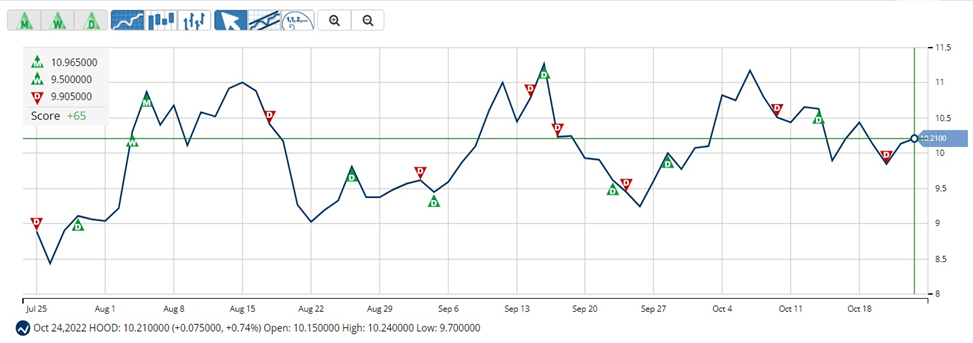
According to MarketClub’s Trade Triangles, the long-term trend for HOOD has been UP since August 4, 2022, and its intermediate-term trend has been UP since August 3, 2022. However, the stock’s short-term trend has been DOWN since October 20, 2022.
The Trade Triangles are our proprietary indicators, comprised of weighted factors that include (but are not necessarily limited to) price change, percentage change, moving averages, and new highs/lows. The Trade Triangles point in the direction of short-term, intermediate, and long-term trends, looking for periods of alignment and, therefore, intense swings in price.
In terms of the Chart Analysis Score, another MarketClub proprietary tool, HOOD, scored +65 on a scale from -100 (strong downtrend) to +100 (strong uptrend), indicating signs of weakening momentum to the upside. While HOOD may be in the beginning stages of a reversal, the long-term uptrend is worth considering.
The Chart Analysis Score measures trend strength and direction based on five different timing thresholds. This tool considers intraday price action; new daily, weekly, and monthly highs and lows; and moving averages.
Click here to see the latest Score and Signals for HOOD.
What's Next for Robinhood Markets, Inc. (HOOD)?
Remember, the markets move fast and things may quickly change for this stock. Our MarketClub members have access to entry and exit signals so they'll know when the trend starts to reverse.
Join MarketClub now to see the latest signals and scores, get alerts, and read member-exclusive analysis for over 350K stocks, futures, ETFs, forex pairs and mutual funds.
Best,
The MarketClub Team
su*****@in*.com


