With retail sales declining more sharply than expected during the holiday month and the third consecutive month of contraction in industrial activity, there is concern on Wall Street that the Federal Reserve may have overcooked it with respect to interest-rate hikes to cool down and contain inflation.
Amid widespread bearish sentiments, it could be wise to bank on fundamentally strong, profitable, and fairly-priced sector-leading businesses, such as Taiwan Semiconductor Manufacturing Company Limited (TSM).
Headquartered in Hsinchu City, Taiwan, TSM provides integrated circuit manufacturing services globally. This involves manufacturing, packaging, testing, and selling integrated circuits and other semiconductor devices.
The super-advanced semiconductor chips that TSM produces are difficult to fabricate due to their high development costs. Hence, this presents a significant barrier to entry into the competition.
On December 29, 2022, TSM held a 3 nanometer (3nm) Volume Production and Capacity Expansion Ceremony at its Fab 18 new construction site in the Southern Taiwan Science Park (STSP).
TSM announced that 3nm technology has successfully entered volume production with good yields. The company estimates that the technology will create end products with a market value of $1.5 trillion within five years of volume production.
On December 6, TSM updated that in addition to its first fab in Arizona, which is scheduled to begin production in 2024, it has also started the construction of a second fab, scheduled to begin production in 2026.
The overall investment for these two fabs will be approximately $40 billion. When complete, TSM Arizona’s two fabs will manufacture over 600,000 wafers annually, with an estimated end-product value of more than $40 billion.
On November 15, it was revealed that Warren Buffett’s Berkshire Hathaway (BRK.B) spent $4.1 billion to acquire a stake in the world’s largest contract chipmaker during the third quarter. According to SEC filings, the fabled conglomerate bought just over 60 million of TSM’s New York-listed American Depositary Shares at an average price of around $68.56.
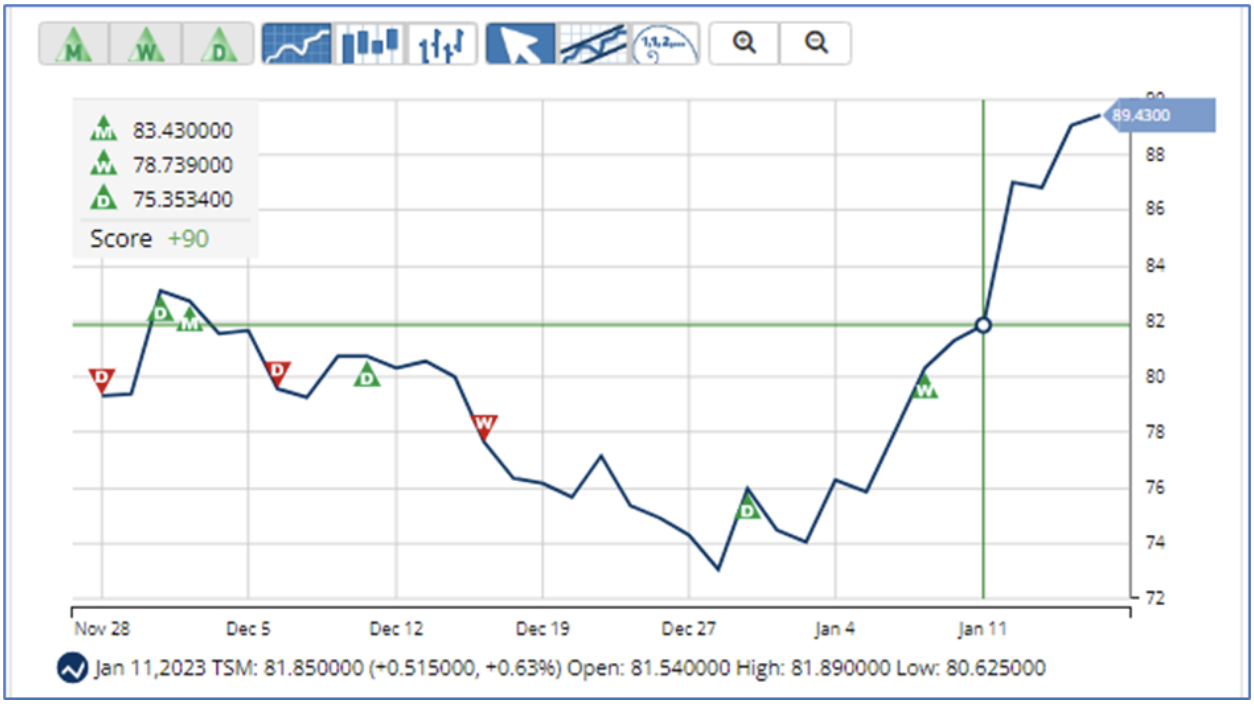
Mirroring the positive developments, the stock has gained 16.9% over the past month to close the last trading session at $89.47.
TSM is trading above its 50-day and 200-day moving averages of $77.44 and $82.48, respectively, indicating an uptrend.
Here is what may help the stock maintain its performance in the near term.
Solid Track Record
Over the past three years, TSM’s revenue has exhibited a 28.4% CAGR, while its EBITDA has grown at a stellar 33.4% CAGR. The company has increased its net income and EPS at a 42.1% CAGR during the same period.
Robust Financials
Despite the fourth quarter of fiscal 2022 ended December 31, characterized by end-market softness and customers’ inventory adjustment, TSM’s net sales increased 42.8% year-over-year to NT$625.53 billion ($20.63 billion), while its income from operations increased 77.8% year-over-year to NT$325.04 billion ($10.72 billion).
During the same period, TSM’s net income and EPS increased 78% to NT$295.90 billion ($9.76 billion) or NT$11.41 per share.
Attractive Valuation
Despite solid financials and upward momentum in price, TSM is still trading at a discount compared to its peers, thereby indicating upside potential. In terms of forward P/E, the stock is trading at 15.73x, 18.9% lower than the industry average of 19.40x.
In terms of the forward EV/EBITDA, TSM is currently trading at 7.94x, which is 40.2% lower than the industry average of 13.26x. Its forward Price/Cash Flow of 8.42x also compares favorably to the industry average of 18.30x.
Favorable Analyst Estimates for Next Year
While TSM expects a challenging fiscal amid weak overall macroeconomic conditions, analysts expect the company’s revenue for the fiscal ending December 2023 to increase 2.2% year-over-year to $76.12 billion.
During the fiscal ending December 2024, TSM’s revenue is expected to increase 20.7% year-over-year to $91.88 billion, while its EPS is expected to increase 23% year-over-year to $7.00.
TSM has also impressed by surpassing consensus EPS estimates in each of the trailing four quarters.
Technical Indicators Look Promising
MarketClub’s Trade Triangles show that TSM has been trending UP for each of the three time horizons. The long-term trend has been UP since December 1, 2022, while the intermediate-term and short-term trends have been UP since January 9, 2023, and December 29, 2022, respectively.
The Trade Triangles are our proprietary indicators, comprised of weighted factors that include (but are not necessarily limited to) price change, percentage change, moving averages, and new highs/lows. The Trade Triangles point in the direction of short-term, intermediate, and long-term trends, looking for periods of alignment and, therefore, strong swings in price.
In terms of the Chart Analysis Score, another MarketClub proprietary tool, TSM scored +90 on a scale from -100 (strong downtrend) to +100 (strong uptrend), indicating that the uptrend will likely continue. While TSM is showing intraday weakness, it remains in the confines of a bullish trend. Traders should use caution and utilize a stop order.
The Chart Analysis Score measures trend strength and direction based on five different timing thresholds. This tool takes into account intraday price action, new daily, weekly, and monthly highs and lows, and moving averages.
Click here to see the latest Score and Signals for TSM.
What's Next for Taiwan Semiconductor Manufacturing Company Limited (TSM)?
Remember, the markets move fast and things may quickly change for this stock. Our MarketClub members have access to entry and exit signals so they'll know when the trend starts to reverse.
Join MarketClub now to see the latest signals and scores, get alerts, and read member-exclusive analysis for over 350K stocks, futures, ETFs, forex pairs and mutual funds.
Best,
The MarketClub Team
su*****@in*.com


