
Software giant Oracle Corporation’s (ORCL) second-quarter revenue and EPS exceeded Wall Street’s estimates. The company’s EPS was 3.2% above the consensus estimate, while its revenue beat analyst estimates by 2.1%.
The strength in cloud infrastructure and cloud-based applications drove a solid topline performance.
Its total cloud revenue, including infrastructure-as-a-service (IaaS) and software-as-a-service (SaaS), rose 48% year-over-year in constant currency to $3.80 billion.
IaaS revenue increased 59% year-over-year in constant currency to $1 billion.
Without the impact of the foreign-exchange rates, ORCL’s adjusted EPS would have been 9 cents higher.
ORCL’s CEO, Safra Catz, said, “In Q2, Oracle’s total revenue grew 25% in constant currency-exceeding the high end of our guidance by more than $200 million. That strong overall revenue growth was powered by our infrastructure and applications cloud businesses that grew 59% and 45%, respectively, in constant currency.”
“Fusion Cloud ERP grew 28% in constant currency, NetSuite Cloud ERP grew 29% in constant currency- each and every one of our strategic businesses delivered solid revenue growth in the quarter,” she added.
For fiscal 2023, the company expects its cloud revenue to grow more than 30% in constant currency compared to the 22% growth in fiscal 2022.
ORCL expects its revenue to rise 17% to 19% on a reported basis and 21% and 23% on a constant currency basis in the third quarter. Also, it expects adjusted EPS for the third quarter to be between $1.17 and $1.21, lower than the consensus estimate of $1.24.
ORCL’s stock has gained 13.3% in price over the past three months and 13.6% over the past six months to close the last trading session at $88.46.
The company paid a quarterly dividend of $0.32 on January 24, 2023. Its annual dividend of $1.28 yields 1.45% on the current share price. It has a four-year average yield of 1.59%.
Its dividend payouts have increased at a 10.1% CAGR over the past three years and an 11% CAGR over the past five years. The company has grown its dividend payments for eight consecutive years.
Here’s what could influence ORCL’s performance in the upcoming months:
Steady Topline Growth
ORCL’s total revenues increased 18.5% year-over-year to $12.27 billion for the second quarter that ended November 30, 2022.
The company’s non-GAAP operating income increased 4.8% year-over-year to $5.08 billion. Its non-GAAP net income declined 2% year-over-year to $3.31 billion.
In addition, its non-GAAP EPS remained flat year-over-year at $1.21.
Favorable Analyst Estimates
Analysts expect ORCL’s EPS for fiscal 2023 and fiscal 2024 to increase 0.1% and 13.7% year-over-year to $4.91 and $5.58.
Its revenue for fiscal 2023 and 2024 is expected to increase 17.5% and 7.5% year-over-year to $49.85 billion and $53.58 billion.
Mixed Valuation
In terms of forward non-GAAP P/E, ORCL’s 18.03x is 10.4% lower than the 20.11x industry average. Its forward EV/EBIT of 15.58x is 7.6% lower than the 16.87x industry average.
However, the stock’s 6.47x forward EV/S is 124.4% higher than the 2.88x industry average. In addition, its 4.78x forward P/S is 64.9% higher than the 2.90x industry average.
High Profitability
In terms of the trailing-12-month gross profit margin, ORCL’s 76.10% is 54.7% higher than the 49.19% industry average.
Likewise, its 20.85% trailing-12-month levered FCF margin is 180.1% higher than the industry average of 7.45%. Furthermore, the stock’s trailing-12-month Capex/Sales came in at 14.49%, compared to the industry average of 2.51%.
Technical Indicators Show Promise
According to MarketClub’s Trade Triangles, the long-term trend for ORCL has been UP since November 15, 2022, and its intermediate-term trend has been UP since October 17, 2022. The stock’s short-term trend has also been UP since February 1, 2023.
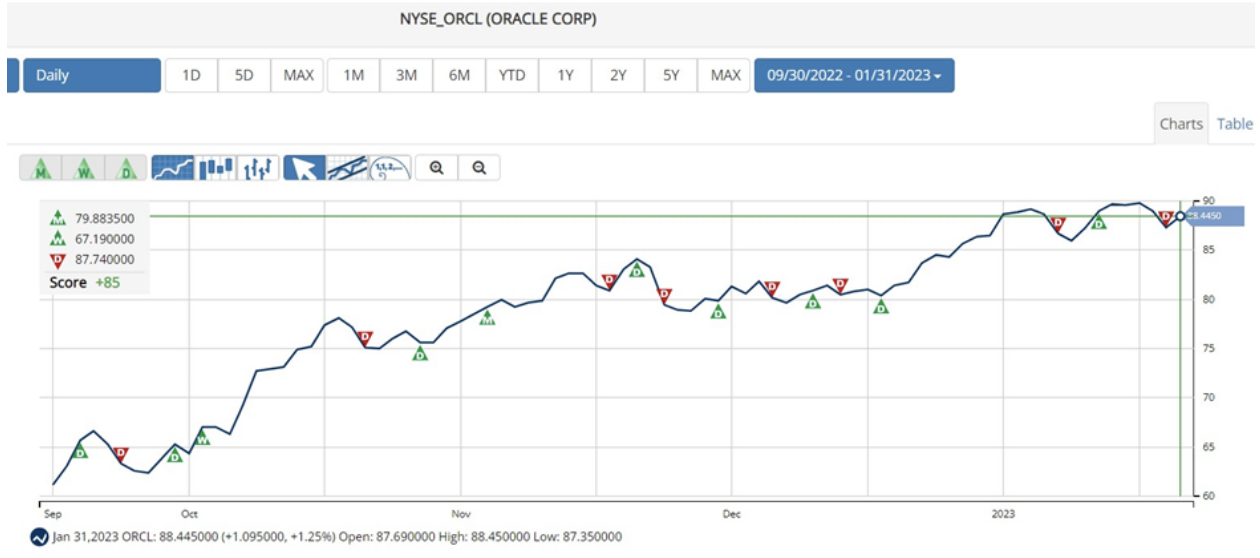
The Trade Triangles are our proprietary indicators, comprised of weighted factors that include (but are not necessarily limited to) price change, percentage change, moving averages, and new highs/lows. The Trade Triangles point in the direction of short-term, intermediate, and long-term trends, looking for periods of alignment and, therefore, intense swings in price.
In terms of the Chart Analysis Score, another MarketClub proprietary tool, ORCL, scored +90 on a scale from -100 (strong downtrend) to +100 (strong uptrend). ORCL is in a strong uptrend that is likely to continue. While ORCL is showing intraday weakness, it remains in the confines of a bullish trend.
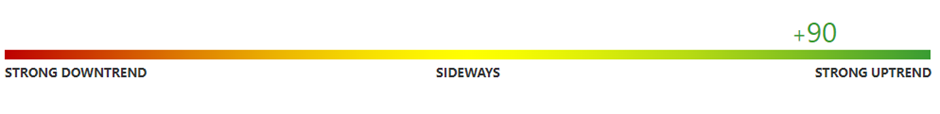
The Chart Analysis Score measures trend strength and direction based on five different timing thresholds. This tool considers intraday price action; new daily, weekly, and monthly highs and lows; and moving averages.
Click here to see the latest Score and Signals for ORCL.
What's Next for Oracle Corporation (ORCL)?
Remember, the markets move fast and things may quickly change for this stock. Our MarketClub members have access to entry and exit signals so they'll know when the trend starts to reverse.
Join MarketClub now to see the latest signals and scores, get alerts, and read member-exclusive analysis for over 350K stocks, futures, ETFs, forex pairs and mutual funds.
Best,
The MarketClub Team
[email protected]
Finally hit the bullseye