
 From time to time, we here at the Traders Blog will feature a person or product that stands out in the trading world. Today that trader is Chris Irvin of the Wizard.com. Chris will be sharing part of his “Go Moment” trading strategy. Be sure to comment below with your thoughts and questions.
Hello traders, I am Chris Irvin, Senior Instructor at The Wizard. For the past eight years I have been doing what I love to do – communicating the intricacies of the financial markets to those who desire to improve their trading skills. I was never a broker, although I previously spent time with a trust company as well as being a registered representative, so all of my market insights have come from my personal experiences as an active trader for over a decade. My goal is to break down difficult concepts and communicate them in an understandable and possibly humorous fashion. I have traveled across the United States, Australia and Canada to help thousands of people become more successful traders. Hopefully, this blog will help you!
Last week I shared my ideas with you regarding what it takes to become a more decisive trader (January 23, 2011 –“Struggling with Decisiveness”). It came down to having a logical, easily executed, trading strategy. The more convoluted a strategy becomes the less likely the trader is to trust it in the long run. Every strategy needs to be tweaked sometimes, and the fewer components the strategy has, the easier the tweaking will be.
The strategy that I wrote about last week was my “Go Moment” strategy. (If you did not read last week’s blog I would encourage you to do so before continuing.) It is a very simple strategy based on one logical concept:
The definition of a bullish trend is “a series of higher highs and higher lows.”
Nowhere in this definition do you see any mention of a lower low. Therefore, if your trend does establish a lower low, at anytime, your trend is over by definition. This is a clear logical signal to get out! Capisce?
So what else can a trader do to become more decisive, and successful? You’re going to hate me for this, but it has to be said. Money Management! (Please keep reading – I know it sounds boring but I promise I will try to keep it interesting.)
My Mom used to say “A known evil is better than an unknown evil.” The evil in this case is the potential loss in any one trade. It seems strange, but the most successful traders are the ones who know they are going to be wrong at some point. Knowing this, these traders always determine the worst case scenario before hitting the “trade” button. These traders will only make the trade if they are comfortable with the worst case scenario. If you are willing to put your entire account balance into a trade without a stop loss, you should be comfortable losing it all. If you are only willing to lose $100.00 in a trade, then you should construct the position so the most you can lose is $100.00. How might you do this? Start by becoming aware of the two different types of risk. The first is “Trade Risk,” and the second is “Account Risk.”
Trade risk is the amount of risk in the position itself. The easy way to think about this is that it is the difference between entry point and stop loss. Let say a stock is trading for $42.20 and my stop loss is being places at $42.00. This means that there is .20 cents worth of trade risk in the position.
Account risk is the amount of money you have determined you are willing to lose in any one trade. This number should be part of your trading plan. Let’s say that for our example, the most we are willing to lose in any one trade would be $100.00.
Trade risk and account risk come together through position size. $.20 cents worth of trade risk divided into $100.00 of account risk would tell you to purchase no more than 500 shares of the stock. This way you know that if your stop loss is hit, you shouldn’t lose more than $100.00. Here is the equation:
Acceptable Account Risk / Trade Risk = Positions Size
If you are a trader that uses a trading program like “The Wizard,” to help you find potential trades, make sure it has a feature that helps determine stop loss positions and trade risk. If you are not sure what this type of program might look like I would encourage you to check out “The Wizard.com” as an example.
Here are a couple of stocks that came back in our scan from last week’s blog.
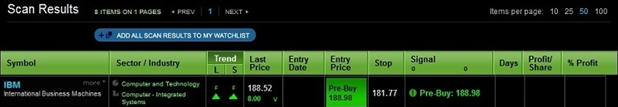
(IBM is only being used to demonstrate the stop loss calculation in the Wizard. It is not intended to be a buy, sell or hold recommendation.)
In this IBM example, the entry price would be $188.89 and the pre-determined stop loss is $181.77. The difference is $7.21. That is the trade risk per share. If your trading plan says you never want to lose more than $100.00 in any one trade then your need to use the previous calculation to determine how many shares you should be trading.
$100.00/$7.21 = 13 shares
If your position size is limited to 13 shares, you might consider looking for another opportunity that will allow you to purchase a larger number.
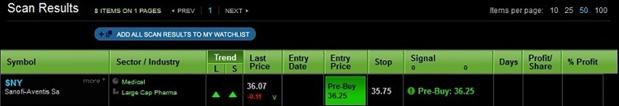
(SNY is only being used to demonstrate the stop loss calculation in the Wizard. It is not intended to be a buy, sell or hold recommendation.)
This SNY example would have an entry price at $36.25 and a predetermined stop at $35.75. The trade risk here would be $.50. Again, if your account risk is capped at $100.00 then your position size must be…
$100/$.50 = 200 shares
Now we all know that there are gaps and other unusual circumstances that can take even the most defensive trader to the cleaners. But over the long haul, a trader that is comfortable with the worst case scenario will be able to decisively enter a position when the time comes.
Follow Up on Last Week’s Scan.
Last Week we ran a scan with The Wizard to search for “Go Moment” candidates. Here are the results.
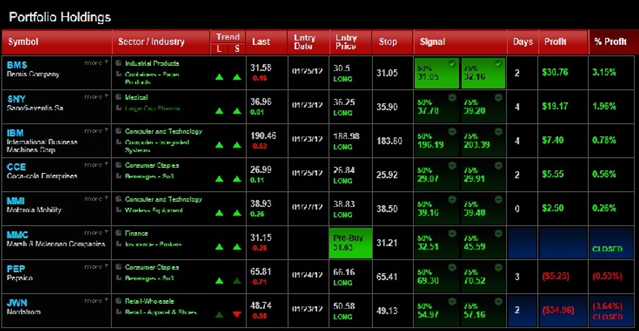
Seven out of our eight potential trades triggered. MMC never triggered because it fell below the stop loss price before it moved above the entry pre-buy price. JWN triggered and was stopped out immediately based on the stop price that was determined prior to getting into the trade. PEP triggered and has retraced but has not hit our stop at 65.41. BMS has hit both its initial and secondary targets as signified by the bright green boxes, and check marks, in the “signal” column. Once BMS has broken above the initial target of $31.05, The Wizard instructs us to remove 50% of the position and take profits. After the second target is hit, The Wizard suggests that we remove another 25% of the profit, and let the remaining 25% run with a trailing stop. The Wizard allows us to set up our trades in one of two ways – Conservative or Aggressive. This scan was done with the conservative model, meaning that profit targets are given when we should reduce our risk by taking profits. The aggressive model does not provide profit targets but instead manages the trade from the bottom. It continually repositions the stop losses to minimize risk on retracements and reversals. The remaining positions (SNY, IBM, CCE, and MMI) are all in winning positions so we will monitor them until we are give a signal to act.
For a minute let’s focus on BMS to evaluate our “Go Moment” strategy. In my previous blog I stated that I have two foundational principles.
Trading with the trend is the safest way to trade- If a stock is in great demand, the trend will be up. Consider the trend as the path of least resistance. The traders that decide to trade against the trend will constantly feel like they are running on a treadmill, never getting anywhere; like they are driving the wrong way on a one way street; like they are swimming upstream.
- You get the point, right? Understanding that trading with the trend is the safest way to trade is a huge step towards becoming a successful trader.
- Trading Breakouts gives the greatest upside potential – Breakouts are the starting point for future volatility. This volatility is the catalyst to large price swings. This is where the money can be found.
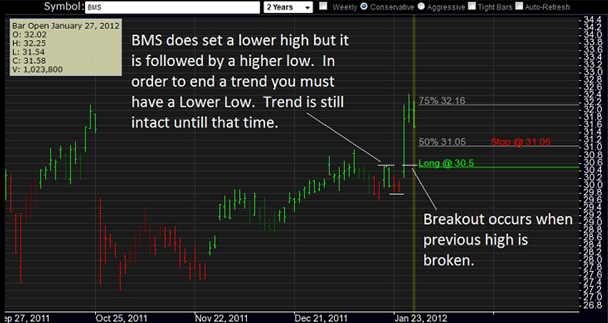
As you can see from the screenshot below we do see a series of higher highs and higher lows which is our definition of a bullish trend.
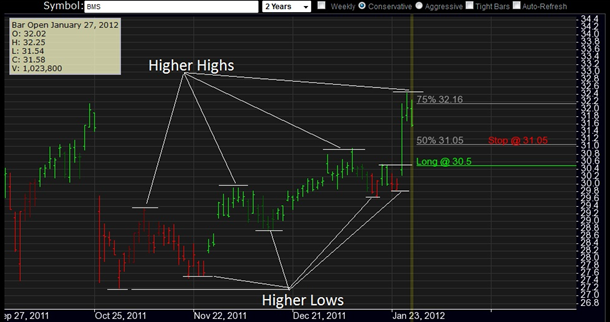
Most of the trend is pretty straightforward except for the end of December when there was a lower high established. A lower high is permitted in a bullish trend as long as it is followed by a higher low. If instead it is followed by a lower low, the bullish trend would be over. As the chart shows, the lower high was the launching point for our breakout.
Regards,
Chris Irvin
Trade platform comments
The “Go Moment” strategy has many challenges from what time frames to follow and how to evaluate all of the thousands of markets choices for opportunities. It can be done on your own but time is such a precious asset to a trader that a trading tool to automate the process is truly valuable.
For many years, I was manually determining my “Go Moment” prospects. Then I ran across an article in the Dallas Morning News which reviewed a trading tool called The Wizard that did both.
I subscribed to The Wizard and tested it out for a couple of months. In finding the trends of the market, it is very accurate. Not only does it give market direction, it also breaks down the trends for specific industries, sectors and individual stocks, ETFs, futures and currency pairs.
The value of a trading tool is measured by success and ease of use. The Wizard updates every night for daily breakouts and on Friday night for the weekly information. A quick scan using my filters generates what I need for the week ahead. Just place the entries and stops on the trend trading breakout candidates… it’s just that easy.
Their breakout prices are what I was really impressed with. The great thing about The Wizard is that you can quickly scan the entire market for potential breakout candidates, which saved me many hours every day trying to find the trade opportunities.
The Wizard is currently running a couple of great offers on the tool. They are waiving their initial set-up fee (which can save you up to $400), so all you have to pay is the $99 monthly subscription fee. There’s also a 30-day money back guarantee with the product, allowing you to test the product out for a month. They also are giving away their Market Trend Indicator for free. This tool tracks the trends in the major indices.
To receive either of these deals, just go to http://thewizard.com/bkak and in the upper right hand corner is the sign-up for the free Market Trend Indicator and under the “Products” tab is where you can receive the “no set-up fee” offer.
If you’d like more information on The Wizard, send an email to
bi**@th*******.com
and they will answer any questions you might have on the product.
I'm going to print this and add it to my mountain of information so that when I go back and read it all it will be there for use when I decide to make my first trade. I thought it was an excellent piece of information.