
 Each week Longleaftrading.com will be providing us a chart of the week as analyzed by a member of their team. We hope that you enjoy and learn from this new feature.
The August Gold Futures suffered through a disappointing week for Gold Bugs in the week ending on June 22nd. The chart began to show very serious promise when buyers began to speculate that the US FED would announce another round of easing. This anticipatory rally drove the market to and through an important trendline that ended at the critical $1600 price. Closes above this level had bulls feeling confident, and bears worried about the next target above the prior June high.
Unfortunately for the Gold Bugs, the market failed below the June high after the FED announced only an extension of Operation Twist until the end of this year. Not only did that news drive prices back to $1600, it also pushed Gold back into the range that began in March of this year.
Prices stabilized at the end of last week after the ECB broke news about expanding the list of securities that would be eligible as collateral, but the price action signaled nothing more than profit taking at the end of the week.
This week the market looks for clues today from the Supreme Court decision on ObamaCare, then more importantly to another EU Summit that concludes on Thursday. If the EU decides to put a plan in place for “Banking Union” that provides fiscal backing of Euro area banking systems, it would be expected that the domino effect would take over and a rally in the Euro would trigger a selloff in the US Dollar, followed by a rally in the Gold. If the EU Summit disappoints this week, it would be expected that further pressure would be seen in many of the commodities that are heavily influenced by the direction of the US Dollar.
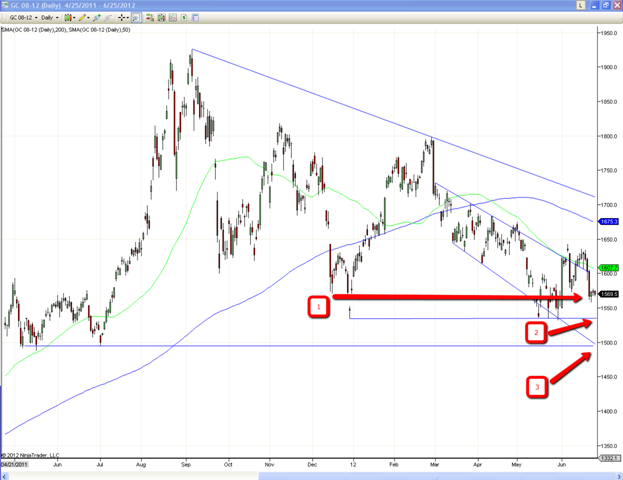
In reference to the daily chart that is shown in this piece, the August Gold futures have closed well below $1600, but have very serious support levels to deal with. The support identified by arrow #1 includes the low prices seen over the last few days and dates back to several lows from December of 2010. If prices break these lows, it would be expected that there would be a test of $1550, then a fourth test this year of the low $1530’s as identified by #2. Lastly, if Gold prices deteriorate even further, the last line of support would likely come in around $1500, where last summer’s lows meet the lowest end of Gold’s four month trading range, shown as #3.
If the Gold is able to recover this week and hold above #1 or #2, I would expect another test of the upper part of the four month range around $1600. Multiple closes outside of this range will not be convincing until Gold closes above the high price from early June. If that happens, look for $1650, then the 200 day moving average (currently at $1675).
If you have any questions or comments, please feel free to contact me directly at my office email
bb****@lo*************.com
or by phone at (888) 272-6926. I will be happy to hear from you.
Thank you for your interest,
Brian Booth
Senior Market Strategist
888.272.6926