This week we have a stock market forecast for the week of 3/27/21 from our friend Bo Yoder of the Market Forecasting Academy. Be sure to leave a comment and let us know what you think!
The S&P 500 (SPY)
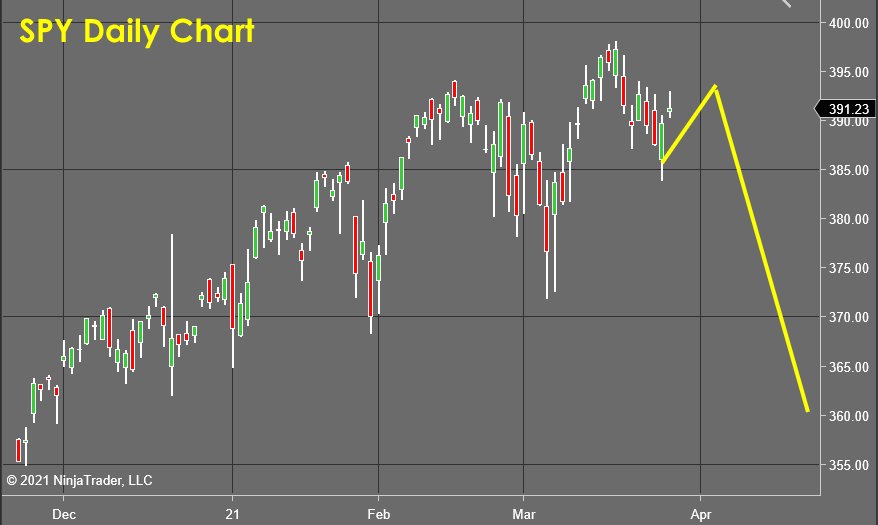
Not a lot has changed in my forecast since last week… I believe the S&P 500 (analyzed here using the ETF SPY) is working its way through a possible head and shoulders reversal pattern on the daily chart. This is a very well understood and recognized reversal pattern and would thus attract a lot of profit-taking activity which I’m expecting to turn the market sharply lower.
For those who are more visual, my forecast for the S&P can be best understood by looking at the yellow lines on the attached chart. The bounce I forecasted last week appeared on schedule and is driving the price up for what I believe will be a failed rally ending as a lower high.
If past historical tendencies hold true, the selling triggered by a successful head and shoulders would be fast and violent until the market had shed 5% or so…This seems to be the trigger level for the “Plunge Protection Team” to come in and attempt to run the market back up to the highs as seen recently on 1/21 and 3/21.
EUR/USD
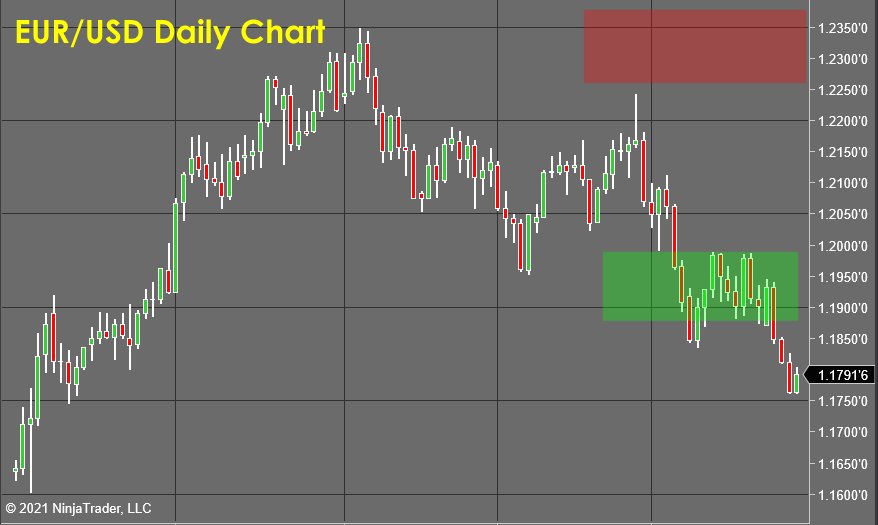
The EUR/USD (Eurodollar vs. the US Dollar) has continued to decline as it goes well below my initial target (seen here as the Green Zone). My proprietary price forecasting tools are showing that the bears have given up a lot of their passion in the last few days, so I would expect this market to turn back to the upside next week as the shorts start to take profits off the table.
If you had a short position in the EUR/USD based on my previous forecast, this would be a good place to lock in gains and go back to the sidelines as we wait to see where the next high probability opportunity is offered.
Coca-Cola (KO)
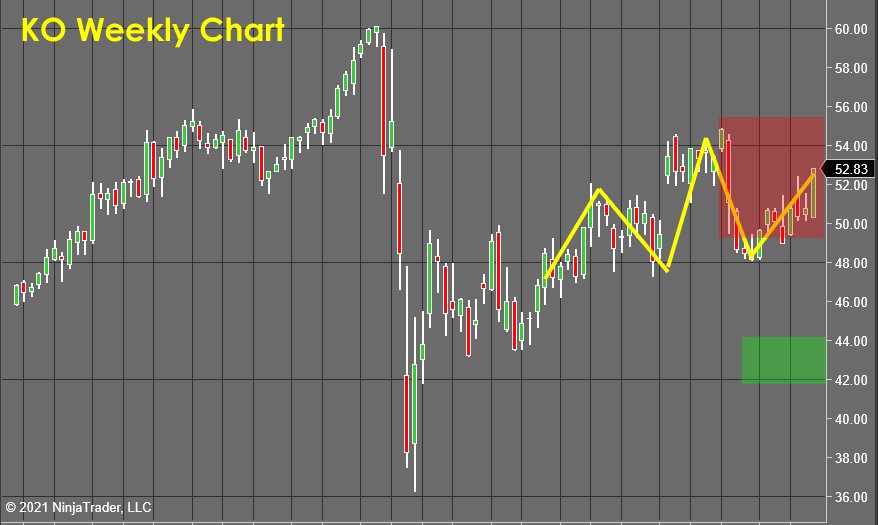
Coca-Cola offered a rare “double short setup” last week as both the daily AND weekly charts showed concentric head and shoulder reversal patterns! I was most disappointed to see that deeply bearish price action could give up and get squeezed out this week as price reached up to wash out the stop-loss orders that were set above the recent daily highs.
The stock continues to trade within the Red Zone, so it is still considered a short opportunity as long as it doesn’t take out the highs near $55. If that were to happen, it would be considered a stop-out.
The bearish energy is still very much dominant, so I’m emotionally disappointed but not truly concerned by this mini-rally. The odds stay clearly biased for a downside move, so I am just standing by patiently as KO works this lower high out.
Gold (GLD)
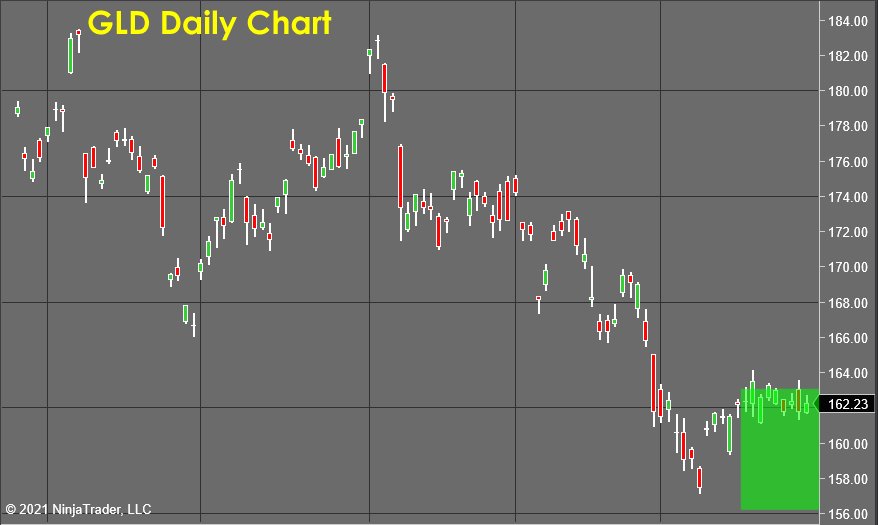
Gold (analyzed here using the ETF GLD) is rewarding me for my patience as it spent the week confirming its recent bottom with a “Pennant” continuation pattern as bullish power builds. I would now consider any price within the Green Zone as “a buy,” with a stop-loss set under the lows of that green zone near $156.
I believe this could be a significant bottom for gold, so I don’t have a specific profit target set for this trade yet. Once the bottoming action attracts more bullish attention, I’ll be in a position to take a set of measurements and get a better sense of the odds and scope of the rally.
I suspect this is one of those longer-term “be right and sit tight” trading opportunities that could be an open position for a while as a new uptrend forms!
Regeneron Pharmaceuticals (REGN)
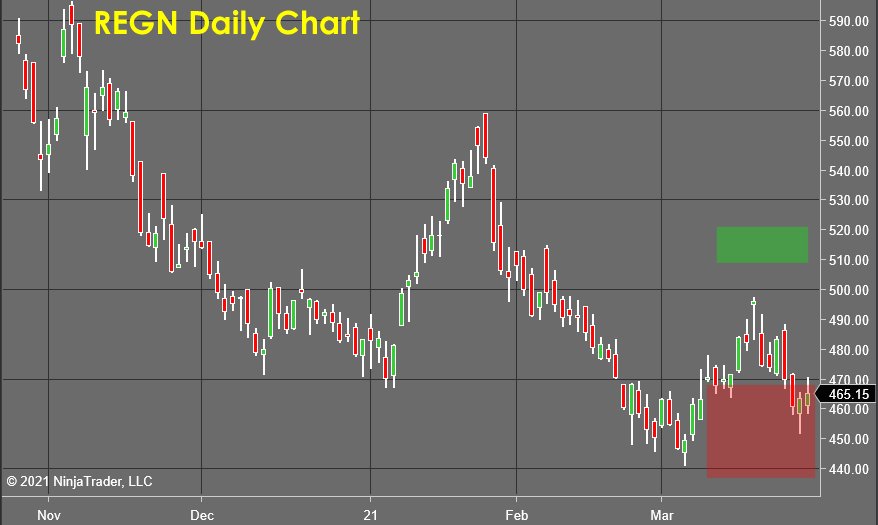
Regeneron Pharmaceuticals (REGN) stock seems to have finished out its first correction as a higher low forms this week on the daily chart.
The price dropped down below the $470 level as forecasted last week, and I believe it has now shaken out the weaker players as the price has rinsed out all the logical entry points.
You see... There are a lot of negative emotions generated when a stock rallies, then gives back all of its paper profits. This “psych out” whipsaw provokes the inexperienced and uninformed to obsess, worry, and second guess themselves, and many of them will panic and exit their trades, often at a loss... JUST before the higher low forms and the bigger moves of a new uptrend are formed.
This price action does offer a nice “second chance entry” for those who missed the initial call or for more aggressive traders who wish to add to the position in anticipation of a rally next week.
Extra Space Storage (EXR)
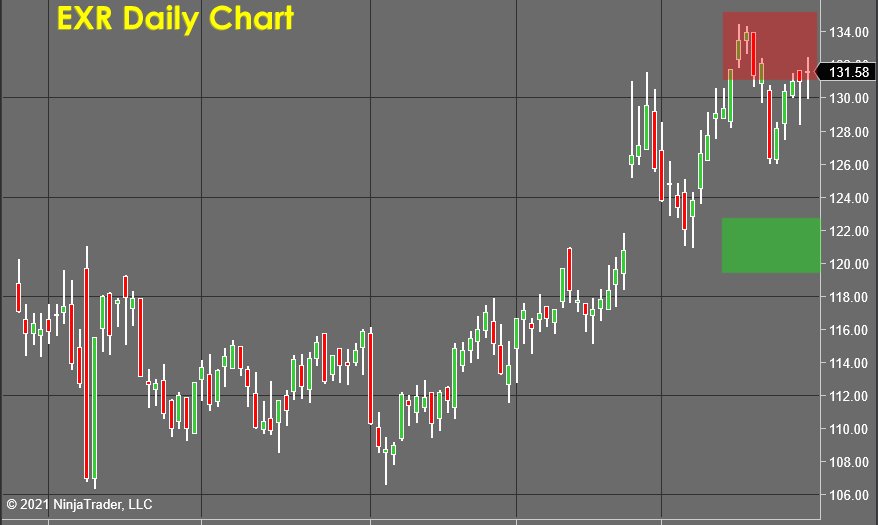
The stock of Extra Space Storage (EXR) is a new opportunity I found while scanning the markets this week. As I look at the underlying supply/demand forces using our proprietary tools, I can see how the bulls are abandoning this stock a the bearish energy builds and becomes dominant.
The stock has formed a “Head And Shoulders” reversal pattern on its daily chart, and this price action should attract the attention of the technical trading community and should turn the price lower next week as the price heads down to test the target area (Green Zone).
This opportunity is considered a valid short anyplace within the Red Zone IF a daily reversal candlestick can form. If this reversal candlestick can present itself, stop-loss orders could be set above its recent highs near $135
To Learn How To Accurately and Consistently Forecast Market Prices Just Like Me, Using Market Vulnerability Analysis™, visit Market Forecasting Academy for the Free 5 Day Market Forecasting Primer.
Check back to see my next post!
Bo Yoder
Market Forecasting Academy
About Bo Yoder:
Beginning his full-time trading career in 1997, Bo is a professional trader, partner at Market Forecasting Academy, developer of The Myalolipsis Technique, two-time author, and consultant to the financial industry on matters of market analysis and edge optimization.
Bo has been a featured speaker internationally for decades and has developed a reputation for trading live in front of an audience as a real-time example of what it is like to trade for a living.
In addition to his two books for McGraw-Hill, Mastering Futures Trading and Optimize Your Trading Edge (translated into German and Japanese), Bo has written articles published in top publications such as TheStreet.com, Technical Analysis of Stocks & Commodities, Trader’s, Active Trader Magazine and Forbes to name a few.
Bo currently spends his time with his wife and son in the great state of Maine, where he trades, researches behavioral economics & neuropsychology, and is an enthusiastic sailboat racer.
He has an MBA from The Boston University School of Management.
Disclosure: This article is the opinion of the contributor themselves. The above is a matter of opinion provided for general information purposes only and is not intended as investment advice. This contributor is not receiving compensation for their opinion.

Friday’s candle on the SPX chart looks like it just broke out of a bull-flag channel. Which means the uptrend shoul
It’s going higher. The head and shoulders is a reliable pattern, but I do not see a well defined H&S here, at all.
This is a forecast looking into the future Ed. The set of proprietary tools that I use give me a real time snapshot of supply and demand forces so I can map out the odds for future price movement.
In this example, the bull flag set up you correctly identify is not heavily sponsored by the bulls, and therefore likely to be a “trap set up“.
If that is the case, it would produce a lower high and a quick move back down to take out the stops below the lows of the recent bull flag. That would complete the head and shoulders pattern, which the market then react to, which would then probably produce more selling… In the meantime, those who have had advanced notice of this possibility/probability are in the driver seat and can react quickly and more efficiently than market players that are simply reacting to price moves.
Are all forecasts correct? Of course not!
But the majority of them will be and that gives me a powerful edge in the markets over time 🙂
Nice technical review. Look forward to more from Bo