This week we have a stock market forecast for the week of 10/24/21 from our friend Bo Yoder of the Market Forecasting Academy. Be sure to leave a comment and let us know what you think!
The S&P 500 (SPY)
The time is finally here...
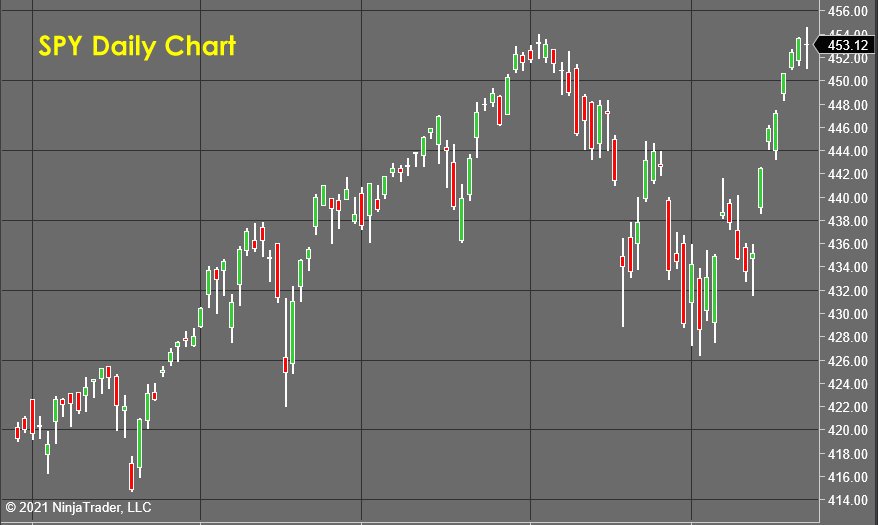
SPY has to choose what to do next.
I switched to the daily chart above this week to show you how the session went on Friday. Price broke out to an all-time high, then turned lower to close out as a "Doji" candlestick. This confirms a major daily double topping pattern, which SHOULD attract aggressive selling on Monday.
I hedge a bit because my forecasting tools show that there will be a larger false breakout than just one tiny intraday "peek." But by the time I start my writing next week, we should have seen some real commitment by the bulls or bears. I want this market short; it's rallying on inflation and fear and "air." There is a big break coming, and I want to be on board.
But in order for that to happen, I have to wait a bit longer. So I'll definitely be active on the short side intraday on Monday.
Caterpillar Inc. (CAT)
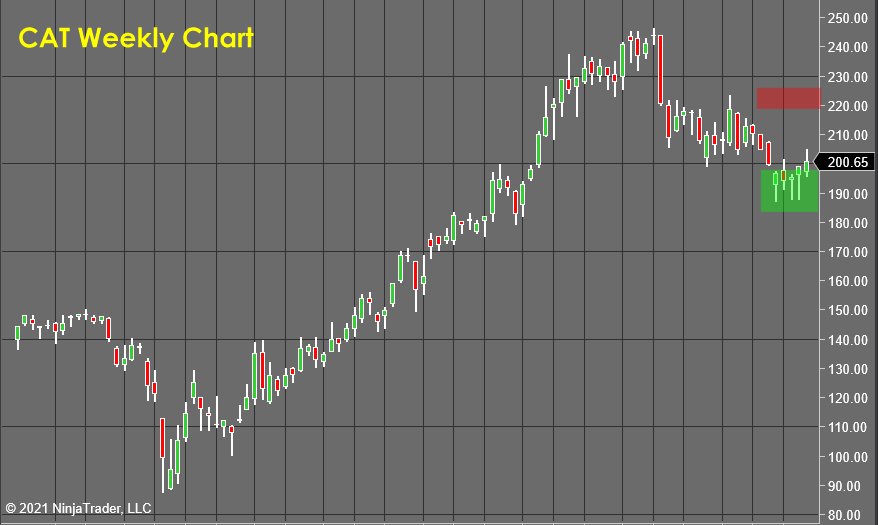
CAT had a good initial week as it lifted up out of the green zone. If the markets have just topped, this trade may struggle, so I may be forced to scratch this next week. I'll watch it closely this week and consider it "on probation" for now.
SPDR Gold Shares (GLD)
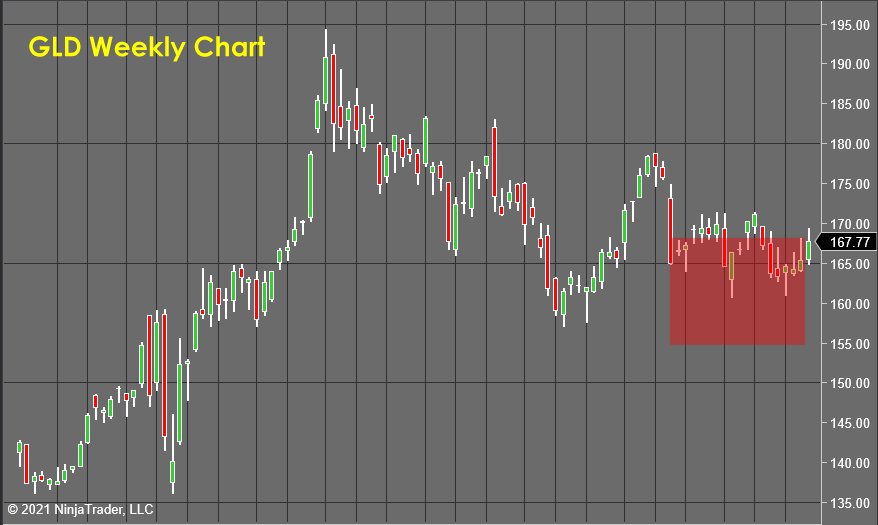
The battle of the candles in GLD ended up with the bulls winning out this week. That means we have dodged a bullet, and I would expect this market to continue to show some relative strength next week, especially if the market drops off after the daily double top.
The PNC Financial Services Group, Inc. (PNC)
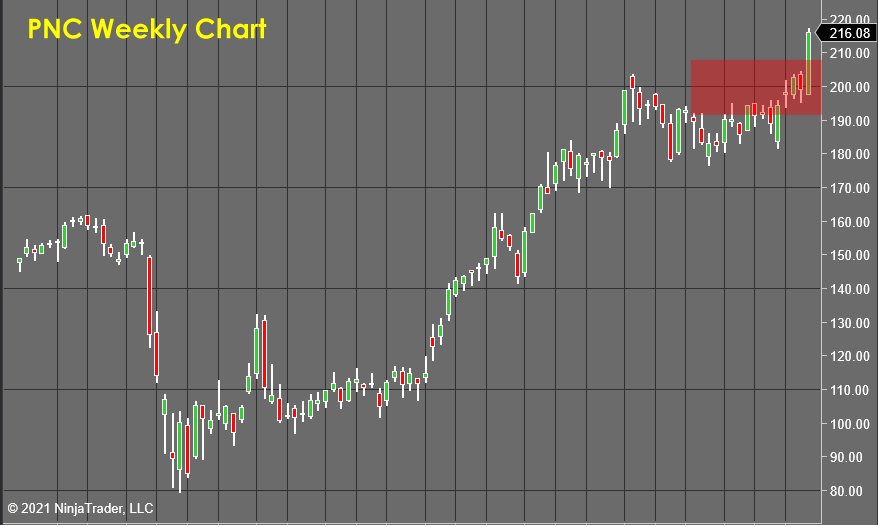
Last week, it looked like PNC might just pull it out, but alas... That was not to be.
Price broke out hard this week and triggered stop losses as the highs of the green box were violated.
The Boeing Company (BA)
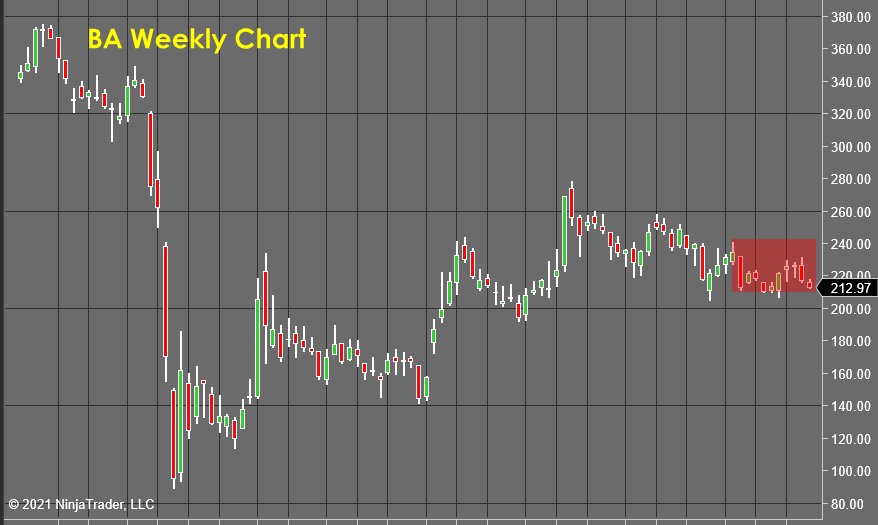
Boeing has had a tough few years. After soaring to nearly $380 per share, it tanked into the scandals, bottoming out nearly $100.
It has been clawing its way back since then and has shown lower, and lower levels of bullish energy at it wallows above the $200 per share level.
I am going to use short exposure here to position myself for profit if the SPY dumps, and since it's a slow and steady trading stock, if the SPY creates a false breakout, this short should survive without triggering stops above the highs of the red zone.
To Learn How To Accurately and Consistently Forecast Market Prices Just Like Me, Using Market Vulnerability Analysis™, visit Market Forecasting Academy for the Free 5 Day Market Forecasting Primer.
Check back to see my next post!
Bo Yoder
Market Forecasting Academy
About Bo Yoder:
Beginning his full-time trading career in 1997, Bo is a professional trader, partner at Market Forecasting Academy, developer of The Myalolipsis Technique, two-time author, and consultant to the financial industry on matters of market analysis and edge optimization.
Bo has been a featured speaker internationally for decades and has developed a reputation for trading live in front of an audience as a real-time example of what it is like to trade for a living.
In addition to his two books for McGraw-Hill, Mastering Futures Trading and Optimize Your Trading Edge (translated into German and Japanese), Bo has written articles published in top publications such as TheStreet.com, Technical Analysis of Stocks & Commodities, Trader's, Active Trader Magazine and Forbes to name a few.
Bo currently spends his time with his wife and son in the great state of Maine, where he trades, researches behavioral economics & neuropsychology, and is an enthusiastic sailboat racer.
He has an MBA from The Boston University School of Management.
Disclosure: This article is the opinion of the contributor themselves. The above is a matter of opinion provided for general information purposes only and is not intended as investment advice. This contributor is not receiving compensation for their opinion.
