If you hang around the markets long enough, you learn a couple of lessons about how they behave really fast. And this holds for BTC:
-
1. The first lesson is that things work out like you thought they would.
2. The second lesson is that things don't work out like you thought they would.
3. And the third lesson is that things work out like you thought they would, but not when you thought they would.
So, when I took a look at what was happening from a technical standpoint to Bitcoin (BTC) over the past couple of weeks, I have to admit that lesson 3 was in full swing.
Here's what I mean.
This Key Chart Pattern Is Working For BTC
In mid-January, we spent time going over the merits of fundamental and technical analysis and how they help us try to figure out where BTC is headed. If you remember, fundamental analysis focuses on what an asset does, how it makes money, and how it interacts with its markets. Technical analysis, on the other hand, focuses on an asset's price patterns and how those patterns influence future price movements.
To bring technical analysis to life, we employed an often-used technical indicator called RSI, which stands for the Relative Strength Index. RSI is a momentum oscillator that shows us how rapidly and how much an asset's price is changing.
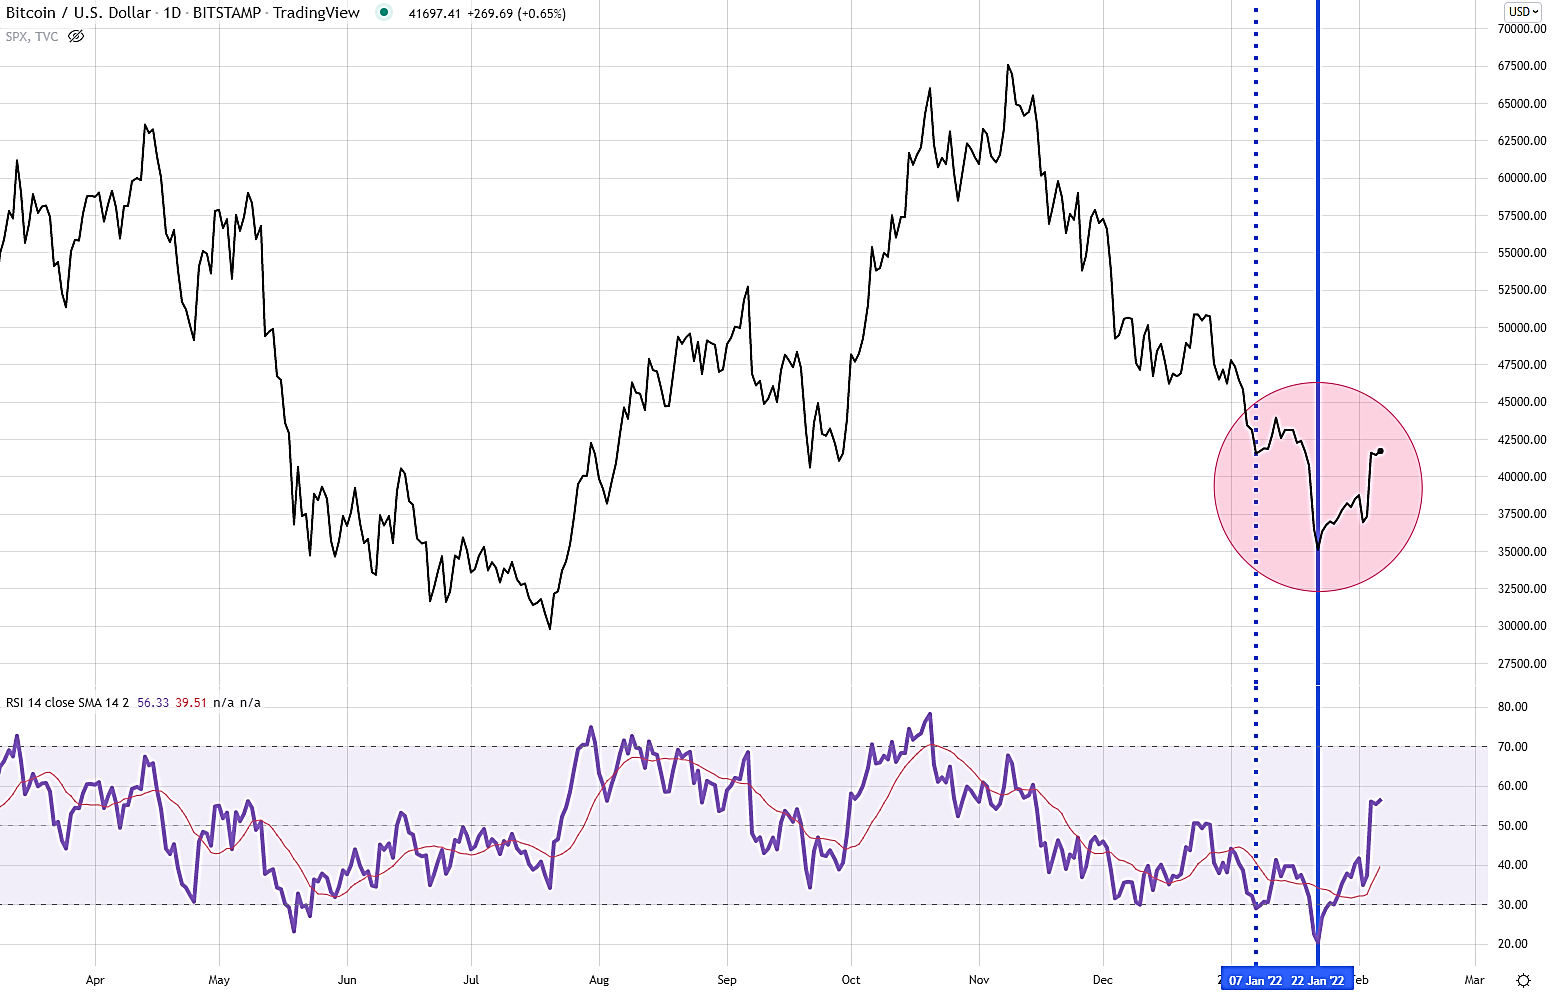
Our thesis was pretty simple: BTC's RSI showed us that oversold conditions in July and September of 2021 ushered in substantial reversals and big upward runs: In fact, BTC's July 2021 reversal led to 77% gains, and BTC's September 2021 reversal led to 62% gains.
We then described that a similar RSI oversold condition was setting up in early January 2022 and could spell a big upward move for BTC, just like it did in 2021.
We may have been a little late, but it looks like what we talked about is coming to life. See for yourself.
As you can see from this chart of BTC, our thought was that a reversal would take place in early January, which would lead to higher gains for BTC. As it turns out, our thoughts were in the right place, just a little late: The reversal we were looking for happened on January 22 (the solid blue line) rather than January 7 (the dotted blue line). Once that reversal was triggered, BTC ran up a solid 25% to $43,726.
That's a huge move and shows that, in this case, at least, RSI worked nicely in our favor.
Another takeaway from this recent action is the depth of the oversold conditions that triggered the reversal. While the bottom boundary of RSI is typically set at 30 for oversold conditions, you can see that we had to wait for RSI to get as low as 20 before the reversal took place. That's another testament that it doesn't hurt to take RSI with a grain of salt. And even better, use it in addition to other technical and fundamental indicators.
Other Factors Pushing BTC Higher
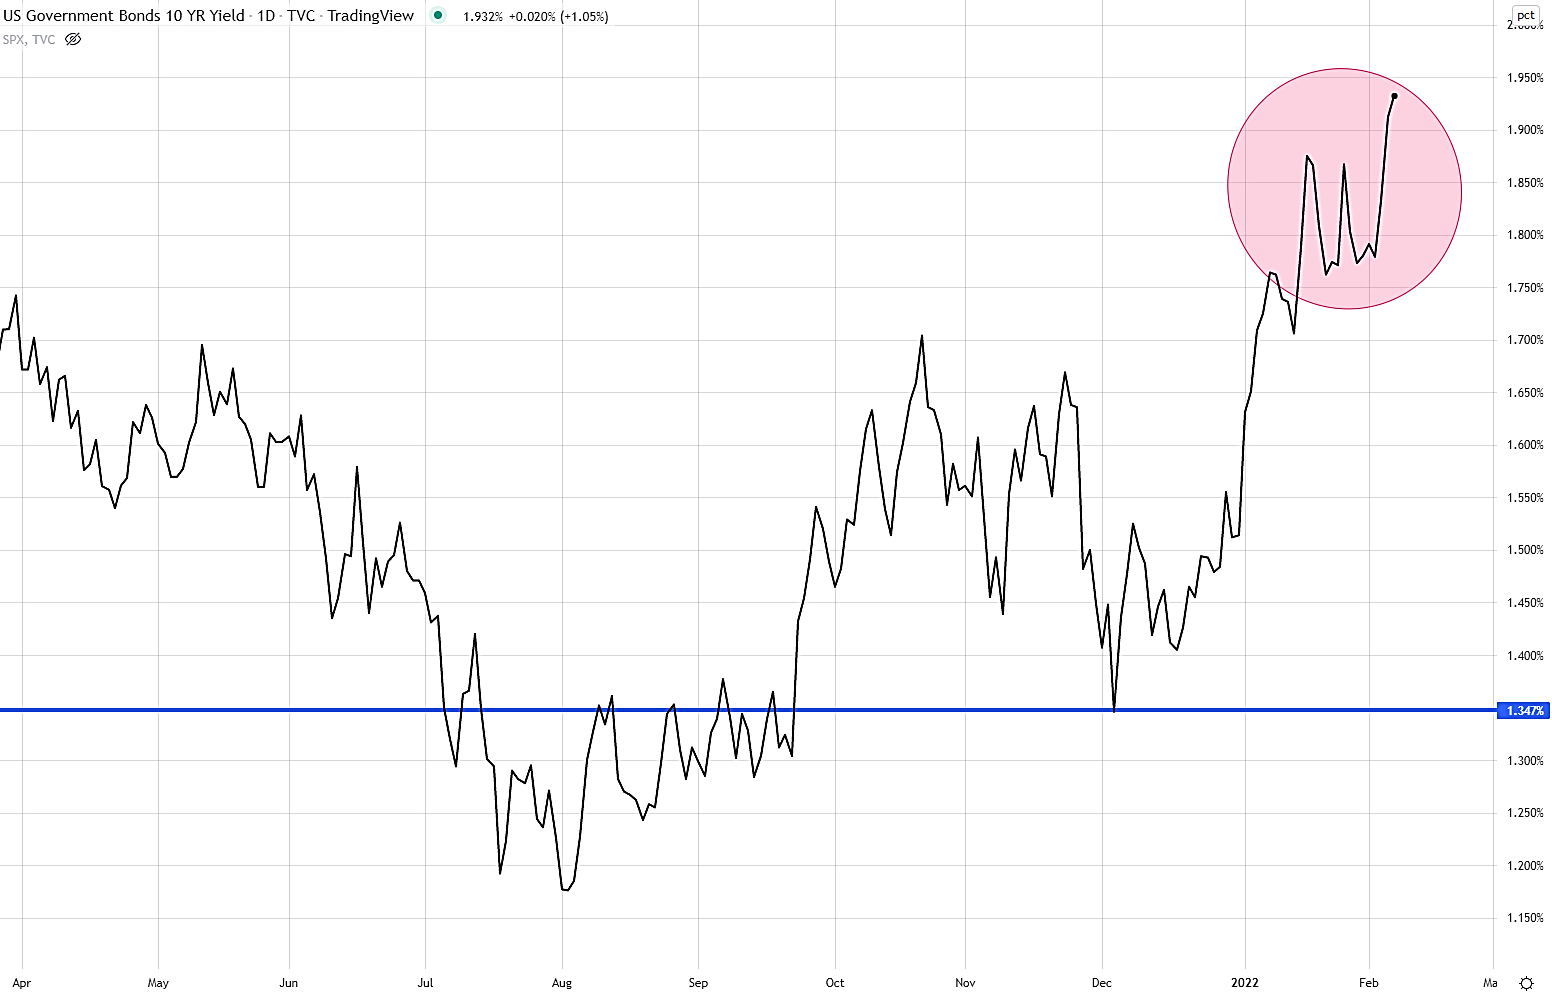
While RSI worked out this time around, it wasn’t the only factor at play with BTC. Take a look at this chart.
This is a chart of the yield on the 10-year U.S. Treasury note. As you can see, we are in the midst of a spectacular rise in 10-year yields. In fact, since its recent low of 1.343% in December 2021, the 10-year is up a staggering 59 basis points to a recent yield of 1.929%. With moves in the 10-year usually talked about in the single-digit area, this latest rise is nothing short of spectacular.
This movement is important for a couple of reasons. Since the 10-year is often used as a barometer of interest rates in the U.S., a rise can mean that mortgage rates and other borrowing costs are likely headed up. This can be a negative for growth but a good way to keep inflation under control. And since inflation is off the charts, this move is entirely predictable. Since rising inflation is bad for all assets, this move is bullish for BTC.
The rise in the 10-year is also important for another reason: Since the price of the 10-year note itself moves in opposition to its yield, the above chart shows that the 10-year note itself is being sold. And since the 10-year is a risk-free asset, selling it means that investors have an appetite for higher-risk assets. This is bullish for BTC, too.
And finally, the rise in the 10-year can mean that investors are anticipating a rise in interest rates down the road and are selling their notes to make room for other buys down the road. Since these kinds of tactical portfolio moves create additional deployable liquidity for investors, it too is a bullish factor for BTC.
Be Cautious
While we may have scored a win using RSI to indicate a future move in BTC, like all indicators, it's not fool-proof. Use it in conjunction with other technical indicators and fundamental analysis. And keep in mind that the rise in the 10-year yield can be bullish for BTC; inflation is still a big problem. And until it gets under control, volatility across all markets will be the name of the game. Be cautious. And remember is keep your crypto investments to no more than 1% to 2% of your portfolio.
Wayne Burritt
INO.com Contributor
Disclosure: This contributor may own cryptocurrencies mentioned in this article. This article is the opinion of the contributor themselves. The above is a matter of opinion provided for general information purposes only and is not intended as investment advice. This contributor is not receiving compensation (other than from INO.com) for their opinion.


