With the moderation of inflation in October and indications of the Fed following suit with a slower interest rate hike next month, the festive season promises to be merrier than expected for consumers and businesses alike.
Retail and consumer businesses whose demand and margins are resilient enough to make them relatively immune to macroeconomic headwinds stand to gain from the increased consumer spending during the holiday season.
Hence, it would be opportune to add Walmart Inc. (WMT), Flowers Foods, Inc. (FLO), and The Simply Good Foods Company (SMPL) as some technical indicators point to sustained upsides that could leave you thankful this season.
Walmart Inc. (WMT)
The retail giant WMT offers opportunities to shop an assortment of merchandise and services at everyday low prices (EDLP) in retail stores and through e-commerce platforms.
The company operates through three segments: Walmart U.S.; Walmart International; and Sam’s Club. Over the last three years, WMT’s revenues have grown at a 4.8% CAGR.
For the third quarter of the fiscal year 2023 ended October 31, 2022, WMT’s total revenues increased 8.7% year-over-year to $152.81 billion, with strength in Walmart U.S., Sam’s Club U.S., Flipkart, and Walmex.
During the same period, the company’s adjusted operating income increased 4.6% year-over-year to $6.06 billion, while its adjusted EPS increased 3.4% year-over-year to $1.50.
WMT’s revenue and EPS for the fiscal year ending January 2024 are expected to increase 2.9% and 8.7% year-over-year to $619.49 billion and $6.60, respectively. The company has an impressive earnings surprise history as it surpassed the consensus EPS estimates in three of the trailing four quarters.
Owing to its strong performance and solid growth prospects, WMT is currently commanding a premium valuation compared to its peers. In terms of forward P/E, WMT is currently trading at 25.13x compared to the industry average of 19.30x. Also, its forward EV/EBITDA multiple of 13.55 compares to the industry average of 12.03.
WMT’s stock is currently trading above its 50-day and 200-day moving averages of $137.68 and $136.70, respectively, indicating a bullish trend. It has gained 9.3% over the past month and 24.3% over the past six months to close the last trading session at $152.42.
MarketClub’s Trade Triangles show that WMT has been trending UP for all three-time horizons. Its long-term trend has been UP since October 28, 2022, while its intermediate-term trend has been UP since October 20, 2022. Its short-term trend has also been UP since November 15.
The Trade Triangles are our proprietary indicators, comprised of weighted factors that include (but are not necessarily limited to) price change, percentage change, moving averages, and new highs/lows. The Trade Triangles point in the direction of short-term, intermediate, and long-term trends, looking for periods of alignment and, therefore, strong swings in price.
In terms of the Chart Analysis Score, another MarketClub proprietary tool, WMT scored +100 on a scale from -100 (strong downtrend) to +100 (strong uptrend), indicating that the stock is in a strong uptrend that is likely to continue. Traders should protect gains and look for a change in score to suggest a slowdown in momentum.
The Chart Analysis Score measures trend strength and direction based on five different timing thresholds. This tool considers intraday price action; new daily, weekly, and monthly highs and lows; and moving averages.
Click here to see the latest Score and Signals for WMT.
Flowers Foods, Inc. (FLO)
FLO is involved in the production and marketing of packaged bakery foods. The company offers fresh bread, buns, rolls, snack cakes, tortillas, frozen bread, and rolls.
Its portfolio includes brands such as Nature’s Own, Dave’s Killer Bread (DKB), Wonder, Canyon Bakehouse, Tastykake, and Mrs. Freshley’s.
Over the last three years, FLO’s revenues have grown at a 4.8% CAGR, while its EBITDA has grown at 6.1% CAGR. During the same period, the company’s net income has grown at 6.2% CAGR.
For the fiscal 2022 third quarter ended October 8, 2022, FLO’s sales increased 12.7% year-over-year to a quarter-record $1.16 billion.
During the same period, the company’s adjusted EBITDA increased 1.6% year-over-year to $120.4 million, while the net income increased 4.3% to $40.5 million. Adjusted EPS for the quarter came in at $0.30.
Analysts expect FLO’s revenue for the fiscal year 2022 to increase 11.5% year-over-year to $4.83 billion, while its EPS for the ongoing year is expected to grow 3.2% year-over-year to $1.28.
In terms of forward P/E, FLO is currently trading at 23.05x compared to the industry average of 19.30x. Also, its forward EV/EBITDA multiple of 14.25 compares to the industry average of 12.03.
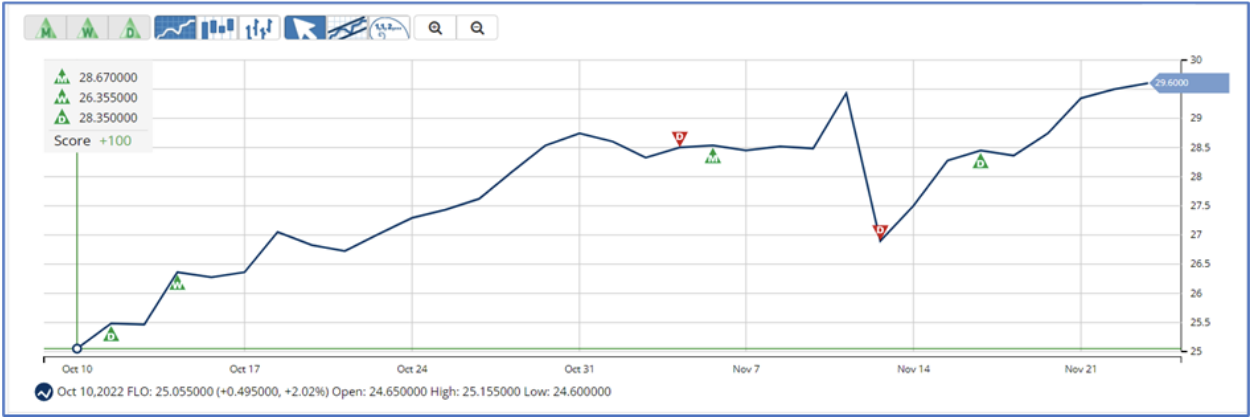
FLO’s stock is currently trading above its 50-day and 200-day moving averages of $26.94 and $26.77, respectively. It has gained 8% over the past month and 13.3% over the past six months to close the last trading session at $29.59.
MarketClub’s Trade Triangles show that FLO has been trending UP for all three-time horizons. The long-term trend for FLO has been UP since October 28, 2022. Its intermediate and short-term trends have been UP since October 13 and November 16, respectively.
In terms of the Chart Analysis Score, FLO scored +100 on a scale from -100 (strong downtrend) to +100 (strong uptrend), indicating that it is in a strong uptrend that is likely to continue. Traders should protect gains and look for a change in score to suggest a slowdown in momentum.
Click here to see the latest Score and Signals for FLO.
The Simply Good Foods Company (SMPL)
SMPL develops, markets, and sells nutritional foods and snacking products. The company’s product portfolio comprises nutrition bars, ready-to-drink (RTD) shakes, snacks, and confectionery products.
Over the last three years, SMPL’s revenue has grown at a 30.7% CAGR, while its EBITDA has grown at a 34.5% CAGR. During the same period, the company’s total assets have grown at 22.4% CAGR.
For the fourth quarter of the fiscal year, ended August 27, 2022, SMPL’s net sales increased 5.5% year-over-year to $247.2 million due to better-than-expected retail takeaway.
The company’s adjusted EBITDA increased 5.2% year-over-year to $51 million during the same period.
SMPL’s quarterly net income increased 65.4% year-over-year to $30.1 million. This translated to an adjusted EPS of $0.36, up 24.1% year-over-year.
Analysts expect SMPL’s revenue and EPS for the fiscal ending August 2023 to increase 6.8% and 1.5% year-over-year to $1.25 billion and $1.61, respectively. Moreover, the company has impressed by surpassing consensus EPS estimates in each of the trailing four quarters.
Given its impressive prospects, SMPL is trading at a premium compared to its peers. In terms of the forward P/E, the stock is currently trading at 23.96x, compared to the industry average of 19.30x.
Also, its forward EV/EBITDA multiple of 17.14 compares to the industry average of 12.03.
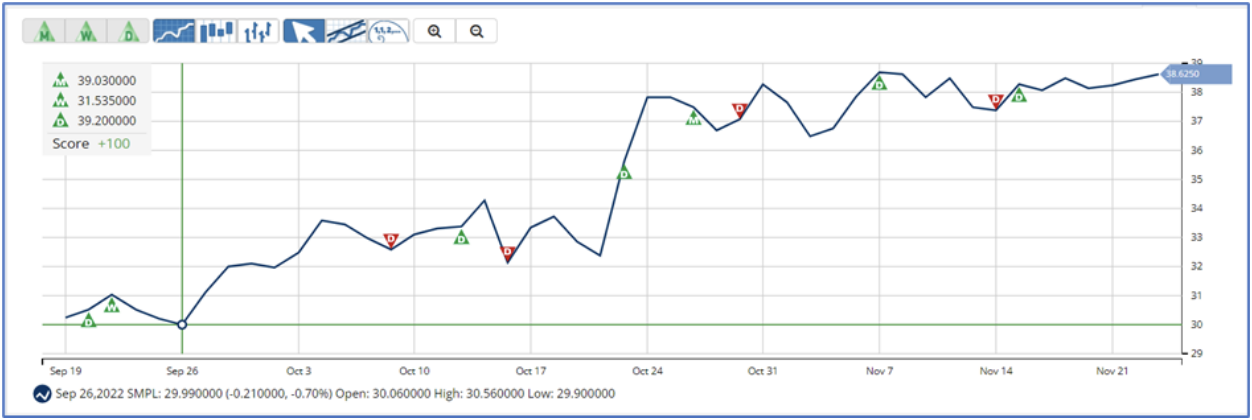
SMPL’s stock is trading above its 50-day and 200-day moving averages of $34.78 and $36.39, respectively, indicating a bullish trend. The stock has gained 4.7% over the past month to close the last trading session at $38.68.
MarketClub’s Trade Triangles show that SMPL has been trending UP for all three-time horizons. The long-term trend for SMPL has been UP since October 26, 2022. Its intermediate and short-term trends have been UP since September 21 and November 15, 2022, respectively.
In terms of the Chart Analysis Score, SMPL scored +90 on a scale from -100 (strong downtrend) to +100 (strong uptrend), indicating that the uptrend is likely to continue. While SMPL shows intraday weakness, it remains in the confines of a bullish trend.
Click here to see the latest Score and Signals for SMPL.
What's Next for These Stocks?
Remember, the markets move fast and things may quickly change for these stocks. Our MarketClub members have access to entry and exit signals so they'll know when the trend starts to reverse.
Join MarketClub now to see the latest signals and scores, get alerts, and read member-exclusive analysis for over 350K stocks, futures, ETFs, forex pairs and mutual funds.
Best,
The MarketClub Team
su*****@in*.com


