
One of our readers’ favorite tools is the Adaptive Dynamic Learning (ADL) predictive modeling system. This tool maps out technical and price patterns into an array of similar setups using historical data, then applies that data to current and future price bars. Using the ADL predictive modeling tool, we can see into the future based on historical technical analysis that maps statistically relevant price activity and shows us the highest probability outcomes.
Monthly ADL Gold Predictions
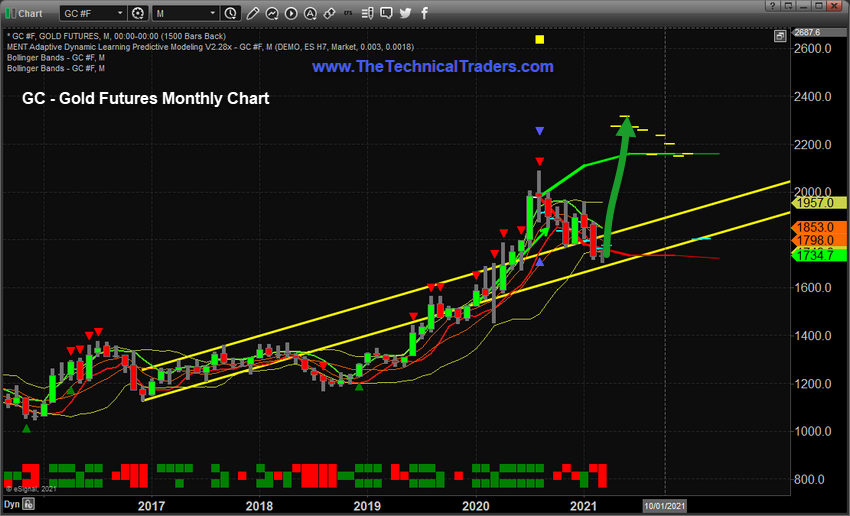
In this research article, we’re going to focus on Gold and how current price action suggests a bottom is likely near the $1720 level. The YELLOW price channels on this Monthly Gold chart highlight exactly where we believe support is located for Gold. If this $1700 price level is breached to the downside, then the previous lows, near $1400, are the next support level for Gold.
Our ADL predictive modeling system suggests the $1720 support level will hold, prompting a new rally to levels above $2200 within 30 to 60+ days. The ADL system predicts an aggressive move in Gold near May or June 2021. The move higher may happen earlier than the ADL Monthly predictions indicate. There is a chance that a move back above $1850 starts the move higher before the end of March or April 2021 – propelling Gold toward the $2300+ peak. The actual peak level predicted by the ADL predictive modeling system is $2315.
2-Week ADL Predicts Gold May Start To Rally Near Mid-March
This 2-Week Gold Chart highlights a similar ADL price prediction. What we find interesting about this ADL predictive modeling outcome is the similar price predictions originating from vastly different origination points. The Monthly ADL prediction originates from a date of August 1, 2020 – the peak price bar. This 2-Week ADL prediction originates from a date of November 23, 2020 – the intermediate low DOJI bar before the recent continue downward trend targeting the YELLOW price channel. Continue reading "Predictive Modeling Suggests A New Gold Rally"