Semi Equipment Book-to-Bill Ratio Moderating

Since we were the only ones (so far as I could see) even talking about the Semiconductor equipment industry ramp up (and positive implications on US manufacturing) back in early 2013 I think we should continue to tend the sector and finish what we started.

Last month the SOX took a massive dive down to our noted long-term support area in a giant swoosh of hype (coming from the financial media by way of one company’s outlook) and emotion by way of stampeding herds trying to get out at all costs.  It was just a setup as the SOX resides at new recovery highs this weekend.

From my days in manufacturing (most of which were spent not directly participating in this sector) I remember the Semiconductor Book-to-Bill ratio (B2B) as a pretty heavily watched indicator among industry types.  From Semi.org:

“The SEMI Book-to-Bill Report provides a first look at the book-to-bill ratio for North American Headquartered Semiconductor Equipment Manufacturers. The three-month average global bookings and billings are a strong indicator for trends in the worldwide semiconductor industry. SEMI follows the protocol established by the U.S. Department of Commerce in publishing our figures only on a three-month average basis. We do this in order to smooth out the natural volatility in bookings. This report is distributed monthly approximately three weeks after the close of each month. Categories covered include front-end (wafer processing/mask/reticle/wafer manufacturing/fab facilities) equipment and final manufacturing (assembly/packaging/test) equipment.”

On November 20 Semi.org published its most recent B2B data.  First their summary and then a table covering the May through October 2014 period. Continue reading "Semi Equipment Book-to-Bill Ratio Moderating"

Goldzilla

"History shows again and again how nature points out the folly of man" – Blue Oyster Cult, Godzilla

I would have written off the gold sector long ago in its ongoing bear market had I thought for one moment that gold's utility as insurance against the acts of monetary madmen/women in high places had been compromised in any way. On the contrary, the monetary metal is simply having its price marked down in a bear market while its value, especially given its current price and all that has gone on in the financial system over the last 3 years remains just fine.

Indeed gold, an element dug out of the ground for centuries, once as money and now as a marker to sound money systems will one day be shown to be a calm oasis from the fallout to global monetary shenanigans currently ongoing. At least it would be an oasis to those who have valued it as such. It is going to feel like a giant dinosaur (minus the kitsch value) ripping through a city built on paper to the multitudes who have taken the bait on the current too big to fail global inflationary operations. They will fail. Timing is the only question. Continue reading "Goldzilla"

Let's Take A Look At The Currency Markets

In light of the news from the land of the rising sun and the sinking currency, let’s reserve NFTRH 315’s only real charting for a big picture monthly view of currencies, to which we usually give just a brief update, and then some misc. big picture monthly charts [not included in this excerpt] as we try to gain perspective on things that may seem illogical to our rational minds.

xjy

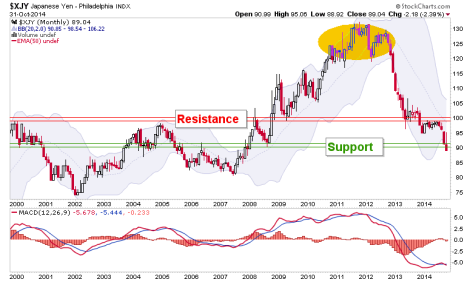
Yen is losing the next level of support.  BoJ saw that support too. I’ll bet they also took note of the big October bounce and found it unacceptable.

xeu

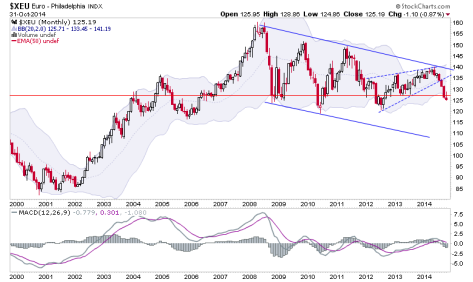
The Euro is losing the support zone after bouncing above it in-month. Continue reading "Let's Take A Look At The Currency Markets"

A Closer Look at the US Dollar

Using the standard weekly currency chart we followed along for months as the Euro found resistance at the long-term downtrend line as expected, the commodity currencies long ago lost major support and non-confirmed the commodity complex and the US dollar moved from a hold of critical support, to a trend line breakout, to its current impulsive and over bought status.  It is time now for a closer look at Uncle Buck since this reserve currency is key to so many asset markets the world over.

As the charts below show, USD is over bought on both daily and weekly time frames.  But the monthly is interesting because its big picture view is that of a basing/bottoming pattern, and it is bullish.  That is a long-term director, so regardless of what happens in the short-term, a process of unwinding the hyper-inflationist ‘Dollar Collapse’ cult is ongoing.  Signs point to disinflation toward deflation.

We’ll start with a daily chart and then ascend right through the weekly and then the monthly to take the pulse of USD.

As noted, the daily chart below is very over bought.  It is currently consolidating the big jerk upward that has come against Euro-negative policy from the ECB and an increasing drum beat about an eventual rise in the Fed Funds rate in the US.  People are finally catching on to the fact that the US economy has been strengthening since early 2013 and that the Fed is looking out of touch holding ZIRP despite this strength.

So the dollar is getting bid up.  The question the chart asks is whether the current consolidation will work-off of another over bought situation, or is a prelude to a reversal?  The answer is going to be key to the bounce potential in many asset markets, but especially commodities, which are generally tanking and precious metals, with gold eventually due to firm after it finishes its bear market and its fundamentals come in line.

usd.daily

You will recognize the weekly chart as it is the top panel of our long-running multi-currency chart.  RSI has been added to this view to show the over bought level.  Note that the weekly has joined the daily in over bought status on this most recent drive, whereas it was merely healthy – and not over bought – the last time the daily registered an over bought reading in July. Continue reading "A Closer Look at the US Dollar"

Sentiment Shifting for Gold Bugs

From a post on the HUI at the site last week:

“There are worse things that could happen than filling a gap and scattering the wrong kind of gold bugs back out.  Then it would be up to the longer-term charts to do the heavy lifting if the daily does fulfill this downside potential.”

The gap was filled, the top end of the anticipated support zone was reached and indeed, the wrong [i.e. momentum players] kind of gold bugs are scattering back out.  The hard sell down on Thursday was very likely due in large part to the selling by traders with a fetish about gold as a geopolitical or terror hedge.

We should continue to tune out these people and while we are at it, tune out the ‘Indian wedding season’ and ‘China demand’ pumpers in favor of real fundamentals like gold’s relationship to commodities and the stock market, the Banking sector’s relationship to the broad market, Junk Bond to Quality credit spreads and US Treasury bond yield relationships.

It’s boring stuff compared to all that demand in China, Modi’s pro-gold regime in India and of course how we are all going to go down the drain amidst war, terror and an age of global conflict unless we have a ‘crisis hedge’.  The only terror gold investors should care about is that perpetrated upon paper/digital currencies by global policy makers.

So last week was good in that it blew out those who were hanging on through the 2 month long grind that did indeed turn out to be short-term topping patterns.  I don’t mind telling you that my patience was tested by the bullish spirits, especially on up days with Ukraine in the headlines.  I did not think it would take 2 months to resolve, but every time the sector looked like it would crack, a new geopolitical flashpoint would show up in the mainstream financial media.

That condition is now being closed out.  Taking its place could be a bottom of at least short-term significance (i.e. to a bounce).  We have a fundamental backdrop that is not fully formed and a big picture technical backdrop that has degraded in gold and silver and is not proven in the equities.  So whether we bounce only, go bullish for an extended rally or even bull market, or (and it’s still on the table folks) fail into the ‘final plunge’ scenario, we are dealing in potentials, not confirmed trends.

Moving on let’s check sector sentiment.

st.au.optix

The current hook down in gold’s Optix (Sentimentrader.com’s aggregated Public Opinion data) is correcting recent surges in optimism.  This is coming amidst a small positive trend.  ‘Uh oh, dumb money is getting positive!’ think contrarians anxiously.  But the historical view shows that the Optix rises in the initial stages of a bull market. Continue reading "Sentiment Shifting for Gold Bugs"