Last September I posted a monthly chart of Copper futures to warn you that the metal has been approaching the area of strong multi-year resistance. In that very same post, I set specific triggers to watch for further price action.
Recently, one of those triggers was broken, and now it’s time to update the chart.
Chart. Copper Futures Monthly: Crucial Support Was Broken
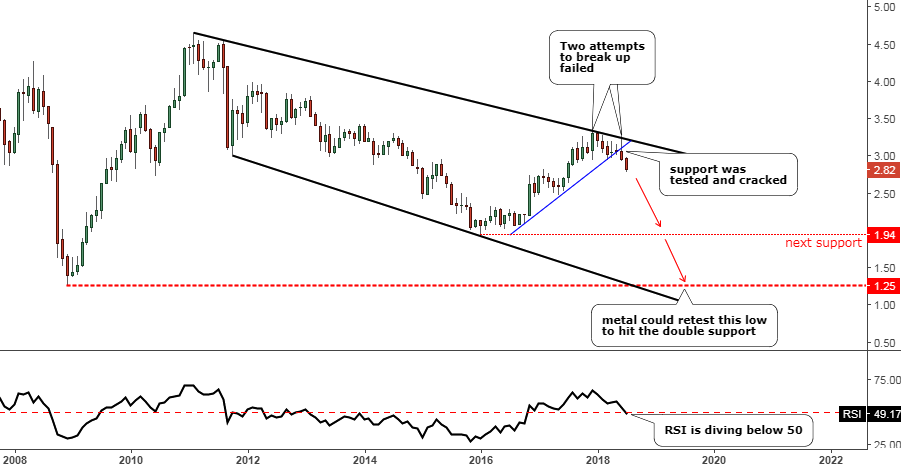
Chart courtesy of tradingview.com
The global chart structure hasn’t changed, and I posted its full reconstruction adding some new annotations to highlight the most recent price action. Continue reading "Copper To Retest $1.94 After Breaking Support"