Gold Miners Trading At Their Largest Discount

Amidst a backdrop of elevated inflation, near-record high gold prices, and negative real rates, many gold bulls are puzzled by the lack of upside follow-through in the Gold Miners Index (GDX). This is because, despite this favorable environment, the index is down 6% year-to-date and 40% from its Q3 2020 highs.

However, it’s important to note that the gold producers are up against significant headwinds which have dented margins, including higher labor, fuel, and materials costs. So, while they have historically performed well in this environment, some of the gold price’s upside has been offset by these rising costs.

Given that the GDX is littered with several high-cost producers with sub-par track records, this has weighed on the index’s performance, dragging down nearly all the stocks in the sector and the GDX.

The good news is that this 22-month decline (August 2020 – June 2022) has left some of the highest-quality miners sitting at their cheapest valuations since Q1 2020.

In this update, we’ll look at three miners that are not only less affected by the inflationary pressures but are trading at a significant discount to their historical multiples: Kinross Gold (KGC), Alamos Gold (AGI), and Wesdome Mines (WDOFF).

Kinross Gold (KGC)

Beginning with Kinross, the company is a 2.0-million-ounce producer with operations in Mauritania,
Brazil, Nevada, Alaska, and Chile.

The company has been performed the worst among its larger peers over the past year, punished by the acquisition of a development-stage project in Canada and after divesting its Russian assets this spring after the invasion of Ukraine.

While the latter development wiped out more than $1.0 billion in net asset value and 300,000 ounces of annual gold production, the company may be better positioned following the divestment, even if the assets were sold for less than fair value. This is because Kinross was not getting much value for its Russian assets (Kupol, Udinsk) anyways and can now command a higher multiple with an Americas-focused portfolio.

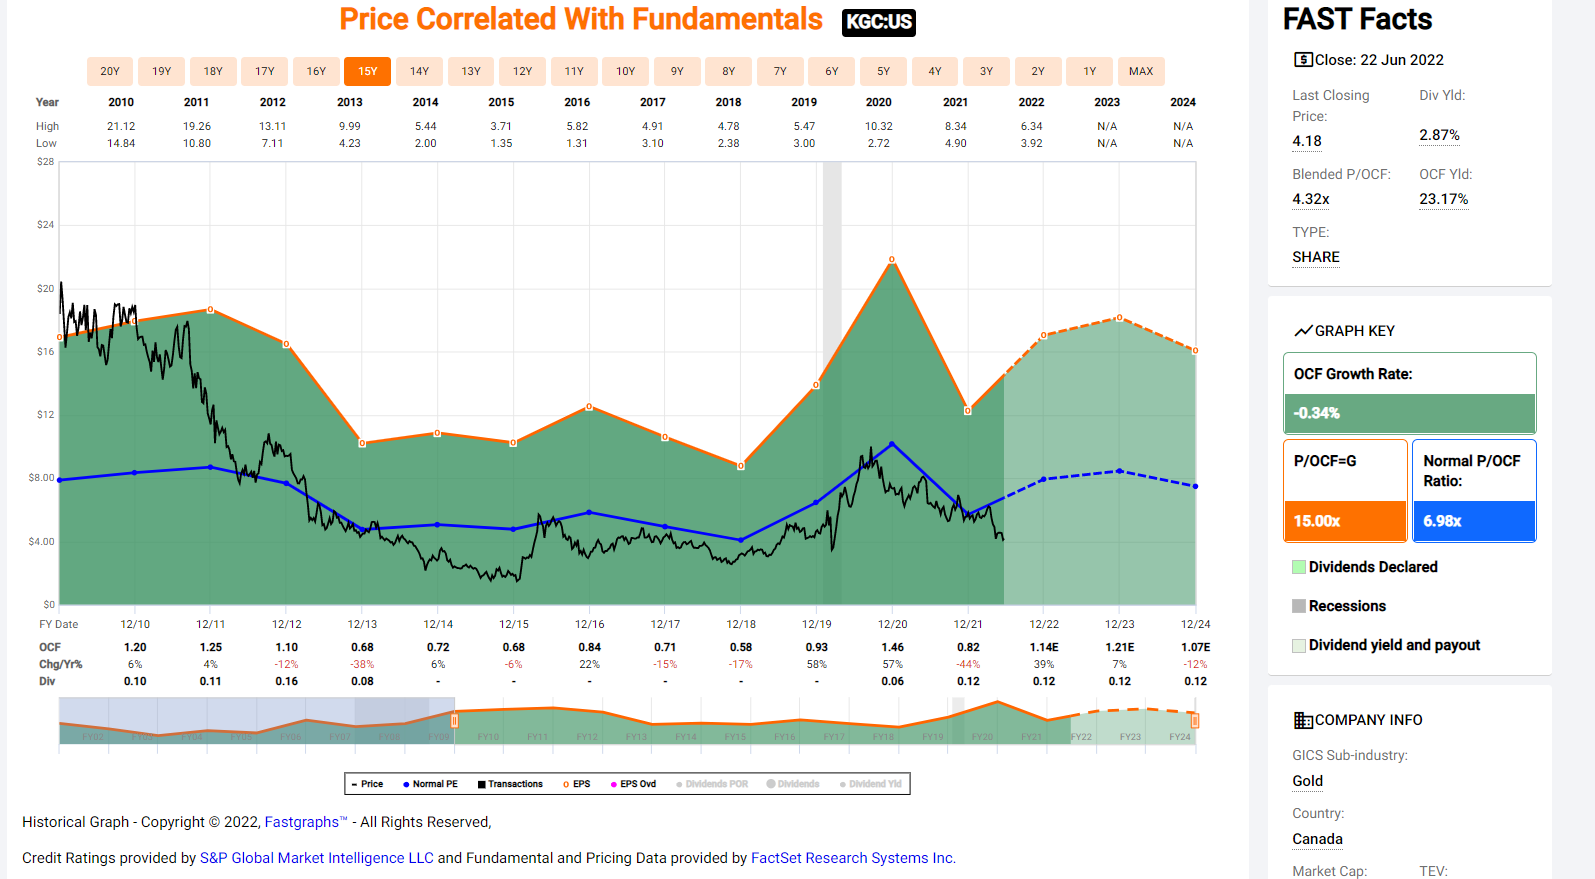
Understandably, investors are disgusted with the stock’s performance, with it down over 60% since Q3 2020. However, at current prices, the correction looks to be overdone.

This is because Kinross has historically traded at 7x cash flow and is currently trading at 3.5x FY2023 cash flow estimates ($1.20 per share). While I think 7x cash flow is a high estimate and 5.5x cash flow is more appropriate, this still translates to a fair value of $6.60 per share, or more than 65% upside from current levels.

It’s also important to note that FY2023 cash flow does not factor in any upside from its Dixie Project that it recently acquired in Canada, which looks to be home to 9+ million ounces of gold and could produce 425,000+ ounces per annum at sub $800/oz costs.

Kinross Historical Cash Flow Multiple

Source: Kinross Historical Cash Flow Multiple, FASTGraphs.com

With production not expected to begin until 2028 at Dixie, this asset has been discounted and Kinross doesn’t get much value for the asset. However, I see a fair value for this asset of $1.7 billion, translating to more than $1.50 per share in additional upside long-term.

While the stock’s 18-month fair value lies 65% higher, the stock has the potential to more than double long-term if it can execute successfully at Dixie. Given this deep discount to fair value combined with a 3.0%+ dividend yield, I see the stock as a steal at $4.00

Alamos Gold (AGI)

The second name worth watching closely is Alamos Gold, a mid-tier gold producer currently churning
out 450,000+ ounces per annum from its three operations in Canada and Mexico.

However, the stock has fallen out of favor recently, given that its costs have risen above $1,200/oz and are expected to come in at levels above the industry average in 2022.

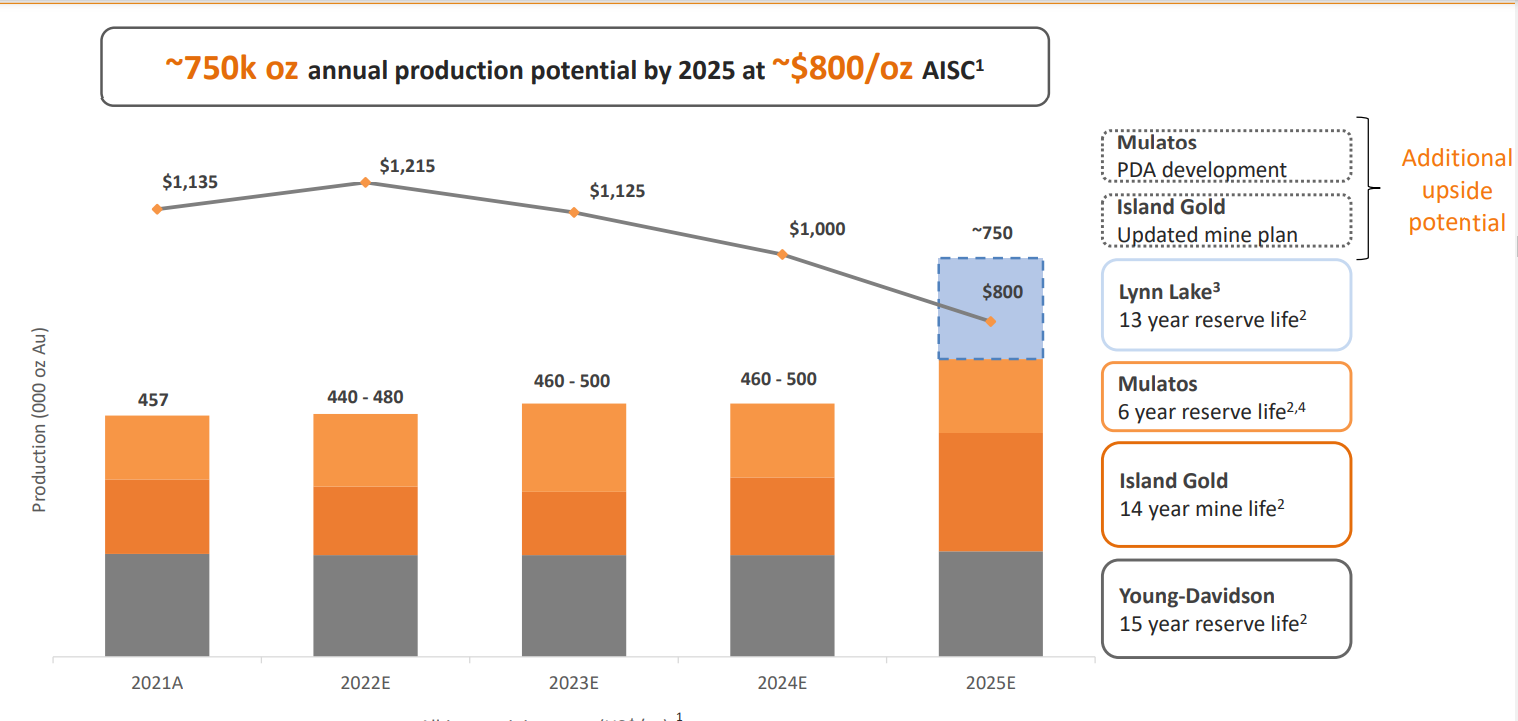
While this certainly dampens the short-term margin outlook ($1,130/oz costs in 2021), Alamos will look like a completely different company by the second half of 2025. This is because it’s currently constructing its Phase 3 Expansion at its high-grade Island Gold Mine, which will push production from ~125,000 ounces per annum to 230,000+ ounces per annum.

Meanwhile, the company aims to construct a 4th mine in Manitoba (Lynn Lake), adding another
150,000 ounces per annum by 2026.

Alamos Gold Growth Plan

Source: Alamos Gold Growth Plan, Company Presentation

If Alamos was only a growth story, it would be unique, and we would already expect it to command a
premium multiple in a sector where growth is hard to find.

However, it’s important to note that this growth will be accompanied by significant margin expansion and a jurisdictional upgrade. This is because its Phase 3 Expansion which will nearly double throughput, is expected to contribute to sub $600/oz costs at Island.

At the same time, Lynn Lake’s costs should come in below $975/oz. The result will be a transformation from a 450,000-ounce producer at $600/oz margins ($1,800/oz gold price) to a ~750,000-ounce producer with $1,000/oz margins ($1,800/oz gold price.

Finally, it will see its exposure to Mexico (Tier-2 rated jurisdiction) dip from 30% to 20%. The result is a company that will enjoy expansion in its P/NAV multiple at the same time as its cash flow increases substantially.

Based on this outlook, I see a fair value for the stock above US$10.00 and view this pullback in AGI as a gift.

Wesdome Mines (WDOFF)

The final name becoming attractive is Wesdome Mines, a junior producer operating out of Canada with
one mine in Ontario and another in Quebec.

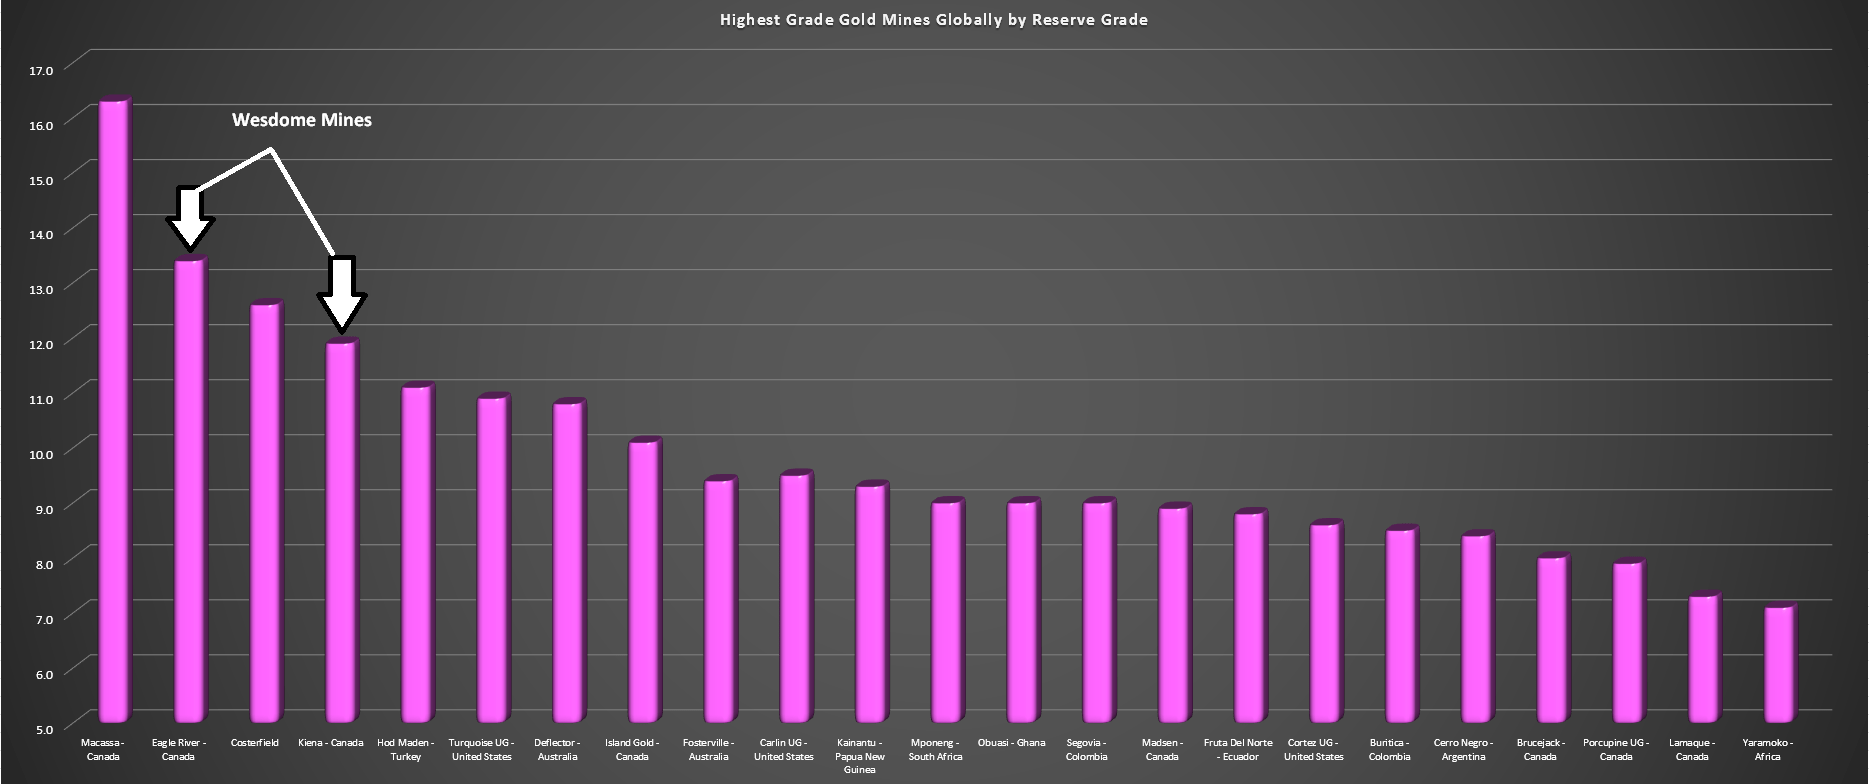
While junior producers are a dime a dozen, Wesdome is special given that it has two of the highest-grade gold mines globally, and it’s busy ramping up to full production at one of them (Kiena) over the next year.

Given its 10+ gram per tonne gold grades, it uses considerably less fuel and labor than its peers per ounce of gold produced, given that it’s moving less than one-sixth the rock volume given its grades.

Highest Grade Gold Mines Globally

Source: Highest Grade Gold Mines Globally, Company Filings, Author’s Chart

Wesdome’s steady ramp-up at Kiena means that while its costs may be above $1,100/oz currently,
they’re expected to slide to less than $825/oz by 2024.

Given this enviable position as a company with meaningful margin expansion on the horizon in a period of slight margin contraction sector-wide, I would view any pullbacks below US$8.00 (key technical support level) as buying opportunities.

Final Thoughts

With the gold miners trading at their largest discount to net asset value in two years, I see now as a favorable time to begin adding some exposure. Given KGC, AGI, and WDOFF’s improving margin profiles looking out to 2025, I believe they are three of the best ways to get exposure to the sector.

Disclosure: I am long AGI, KGC

Taylor Dart
INO.com Contributor

Disclaimer: This article is the opinion of the contributor themselves. Taylor Dart is not a Registered Investment Advisor or Financial Planner. This writing is for informational purposes only. It does not constitute an offer to sell, a solicitation to buy, or a recommendation regarding any securities transaction. The information contained in this writing should not be construed as financial or investment advice on any subject matter. Taylor Dart expressly disclaims all liability in respect to actions taken based on any or all of the information in this writing. Given the volatility in the precious metals sector, position sizing is critical, so when buying small-cap precious metals stocks, position sizes should be limited to 5% or less of one's portfolio.

Critical Report Due Out On Wednesday

Chairman Powell’s testimony before Congress this week painted a dire economic outlook which will include the continued contraction of the national GDP coupled with continued interest rate hikes.

During his testimony, it was evident that there was a subtle difference in his word track that was uncharacteristic and a dramatic change from his usual refined method.

The chairman made it clear that the Federal Reserve has one goal in mind above all others and that is to reduce the level of inflation. They emphatically stated that the actions of the Federal Reserve will most likely lead to a recession rather than a soft landing.

Yahoo finance captured his overall demeanor in a most articulate manner saying, “He said a recession caused by the Fed’s own monetary tightening remains a “possibility.”

A soft landing, with higher rates but a still-healthy economy, would be “very challenging” to achieve. And Powell said the Fed’s fight against inflation was “unconditional,” meaning nothing will stand in its way.”

The revisions by the Federal Reserve to their monetary policy most certainly would contract the economy and bring on a recession.

A recession is defined as “a period of temporary economic decline during which trade and industrial activity are reduced, generally identified by a fall in GDP in two successive quarters.”

The last GDP report revealed that the United States had an economic expansion leading to a 6.9% growth in the GDP for Q4 of 2021. If advanced estimates for the GDP Q1 are correct it will indicate a decrease in the real gross domestic product (GDP) for the first quarter of this year.

The last occurrence of a contracting GDP quarter to quarter occurred during Q2 of 2020. However, the following quarter (Q3 2020) revealed a robust increase in national GDP.

This is why next week’s report is so critical. On Wednesday, June 29 the BEA (Bureau of Economic Analysis) will release the U.S. GDP first-quarter report.

According to the advanced estimate released on April 28, “Real gross domestic product (GDP) decreased at an annual rate of 1.5 percent in the first quarter of 2022, according to the "second" estimate released by the Bureau of Economic Analysis. In the fourth quarter, real GDP increased 6.9 percent.”

Currently, there is a high probability that the actions of the Federal Reserve will lead to a recession. The question is not whether or not the United States will enter recession but rather when the recession will begin and how long the recession will last.

Daily Gold Chart

While a recession can stabilize gold pricing, and higher inflation certainly creates a bullish undertone for the precious yellow metal, rising interest rates have become a primary focus on the future price of gold and has pressured pricing lower since March of this year.

Gold has declined just over 12% from the highs of $2070 in March to gold’s current pricing of $1828. While it seems as though there is strong support for gold at $1800 depending on how aggressive the Federal Reserve becomes in regard to further rate hikes.

Besides the GDP report due out on Wednesday, on Thursday the government will release its latest core inflationary numbers when the U.S. PCE price index report is published.

For those who would like more information simply use this link.

Wishing you, as always good trading,
Gary S. Wagner
The Gold Forecast

Gold Bugs Better Not Look At These Charts

Last week the Fed has lifted its benchmark interest rate aggressively by 0.75 percentage points and that was the biggest increase since 1994. This decision came with the yearly inflation of 8.6% in May running at its fastest pace since December 1981.

Moreover, new hikes are to come this year as the Fed’s benchmark rate is targeted at 3.4% by the end of this year, according to individual FOMC members’ expectations. This factor puts downward pressure on asset prices across the market. Bonds are definitely on that list.

I found an alarming correlation between gold and 10-year U.S. government bonds (10b) that appears these days in the chart below.

Gold VS US 10Y Bonds Monthly

Source: TradingView

The gold price (orange) and the 10b price (futures, black) have a similar trajectory over the considered period since 2006. The blue sub-chart with the indicator of correlation confirms the strong link between these two trading instruments.

The price line of gold looks smooth compared to a volatile 10b line. The major peaks match with each other both during the previous peak in 2011 and the most recent top.

However, the area between peaks does not show the perfect correlation as the gold price continued to the downside from the earlier top while the 10b reversed to the upside in 2014. The top metal had led the drop that time.

This time, we see a strong divergence between assets. The 10b was first to drop like a rock as the inflation spiral only grows. The gap is already too big as the gold price stubbornly keeps under the all-time high. Time is ticking away for the yellow metal which should show a breakup of the major top to keep bullish, otherwise… just look where 10b is now.

The bond price has hit a low of around $114 this month, the level unseen since June 2009. At that time, the gold price had hit the low of $913. I marked the current corresponding level of gold at $910 with the red dotted line. This means that the top metal could lose half of its current price to dive below the valley of 2015 at $1,046.

Do you see the correlation between gold and 10-year U.S. government bonds?

View Results

Loading ... Loading ...

Last year I had shown you the map of possible large leg 2 down to extend the correction in the wake-up call for gold. It is time to dust it off and update here.

Gold Monthly

Source: TradingView

The right green zigzag inside of the right orange box extended higher than expected. However, it could not break the all-time high to repeat the pattern in the left orange box. The chance to continue to the upside is evaporating over time.

The drop below the red dotted support ($1,700) with the bearish confirmation from the RSI sinking under the 50 would open the way for the second large red leg to the downside. It could retest the 2015 low of $1,046.

In my previous gold update, I shared with you the bullish ascending triangle pattern spotted on the weekly chart.

The gold price did not progress to the upside within the pattern as it was supposed to. On the contrary, it almost fell out below the support of a triangle to challenge the validity of the pattern.

The RSI is still under the so-called “waterline” of 50. The collapse below $1,677 mark would totally invalidate the pattern.

The Fed could tighten its policy until it “breaks” the economy as there is a substantial lag between its action and the following effect on the economy. In the meantime, let us watch and see which of the gold triggers appear first – bullish or bearish.

Intelligent trades!

Aibek Burabayev
INO.com Contributor

Disclosure: This contributor has no positions in any stocks mentioned in this article. This article is the opinion of the contributor themselves. The above is a matter of opinion provided for general information purposes only and is not intended as investment advice. This contributor is not receiving compensation (other than from INO.com) for their opinion.

A Pivotal Juncture for Gold

With FOMC on tap with an upcoming .5% rate hike, gold got hammered and bounced back with a vengeance on ‘CPI’ Friday. The Fed will raise the Funds Rate at least .5% next week. So says not me, but the wise guys whose job it is to correctly anticipate FOMC policy. Indeed, a full 20% of CME traders expect .75%, up from our last check on June 3.

Meanwhile, the gold price (futures) was unceremoniously shoved below the daily chart’s SMA 200 before pulling its bounce back routine on CPI Friday. Check out that reversal volume. This is notable stuff and with FOMC in the wings, it is doubly so.

To NFTRH, unlike many gold/commodity observers, gold is far different from the other inflated stuff. It has far more counter-cyclical aspects to it than copper, industrial materials, energy commodities and even to a degree, silver. Continue reading "A Pivotal Juncture for Gold"

Gold Update: Window Of Opportunity Still Open

Last month I spotted a “Repeated Bullish pattern” of another Cup & Handle model.

The majority of readers confirmed that they see it either. Most of you supported my outlook of an extended Handle with another zigzag to the downside. This was the right guess. Let me show it to you in an updated chart below.

Weekly Gold Chart

Indeed, the gold futures price followed the black zigzag on the chart to the downside. Hence, the outlook played out as planned. However, the depth of the drop was excessive as it hit below the expected valley of 50% Fibonacci retracement level and even 61.8%. The collapse stopped only close to four-fifths of the Cup. The classic approach would invalidate the pattern in this case. Continue reading "Gold Update: Window Of Opportunity Still Open"