Breakout for Stocks or Fake Out?

Please enjoy this updated version of weekly commentary from the Reitmeister Total Return newsletter. Steve Reitmeister is the CEO of StockNews.com and Editor of the Reitmeister Total Return.Click Here to learn more about Reitmeister Total Return


SPY – Once again stocks flirted with the all time highs for the S&P 500 (SPY). This has happened 2 times recent both leading to failure and this 3rd time doesn’t seem to be the charm either. What is holding stocks back from making new highs? And what should an investor do to find better performance? 43 year investment veteran Steve Reitmeister shares his view including a preview of his 11 favorite stock picks now. Read on below for the answers…


In my recent commentaries I have speculated that we were due for a trading range to digest some of the rampant gains at the end of 2023. However, so far it has been more of a consolidation under the all time highs at 4,796 for the S&P 500 (SPY).

Consolidations are simply much tighter trading ranges. That investors refuse to have a serious sell off while also not being ready to climb higher. Kind of feels like cars revving up at the starting line of a race…lots of noise, but going nowhere.

We will discuss more of the reasons behind this consolidation and when stocks should be ready to race ahead.

Market Commentary

Stocks have tried twice over to make new all time highs above 4,800 for the S&P 500. And twice thwarted at that level followed by share pullbacks.

Yes it looks like Thursday’s action signals a 3rd such attempt. Yet that was a very hollow rally with the usual suspects in the S&P 500 doing well with small caps and other riskier stocks lagging. That is not the sign of a healthy bull. And give very low odds of breaking to new highs.

(1/20/24 update: Yes, the S&P 500 officially made new highs above 4,800 on Friday. I honestly thought it was a fairly hollow rally mostly led by the usual mega cap tech stocks and not such a broad rally. Meaning I do not believe this rally has staying power and likely will fall back below 4,800 this coming week. And at best we consolidate just above 4,800 with little true upside coming in the days ahead).

Some are pointing to economic data being too weak as the problem. Such as the horrific -43 showing for the Empire State Manufacturing Index on Tuesday.

While others are pointing to economic data being too strong like Retail Sales being above expectations on Thursday. This had 10 Year Treasury rates breaking further above 4% and also lowered the odds of the first rate cut coming at the March Fed meeting.

Sorry folks…you can’t have it both ways. And perhaps the answer is that neither of these theses are correct.

Meaning I don’t believe that investors are truly worried about a looming recession. Nor are they fearful of rates spiking again as they did in the Fall of 2023.

Simply, the market has come a long way from bear market bottom in October 2022. A total gain of 37% from that valley to now is a lot of profit in a short time when the long term average annual gain for the S&P 500 is only 8%.

So now is a healthy time for an extended pause. The same way you would take a long break after running a marathon.

Rest is what is needed. And then gaining the strength for the next run higher.

In the stock market world that typically comes hand in hand with a pullback in price leading to a trading range. Along with that you will see these investment terms show up more often:

  • Profit taking
  • Sector rotation
  • Change of leadership
  • Buy the Dip
  • The Pause that Refreshes
  • And so on…

Yet right now the most apt term is consolidation. As shared up top, that is simply a very tight trading range right under a point of resistance. Currently that resistance corresponds with the all time closing highs at 4,796…but for simplicity easier to think of it as 4,800.

The point is at this stage it is healthy and normal for stocks to relax after such a long run higher. Don’t be surprised if the consolidation does turn into a wider trading range with a subsequent test of the 50 day moving average at 4,628 being a likely downside target.
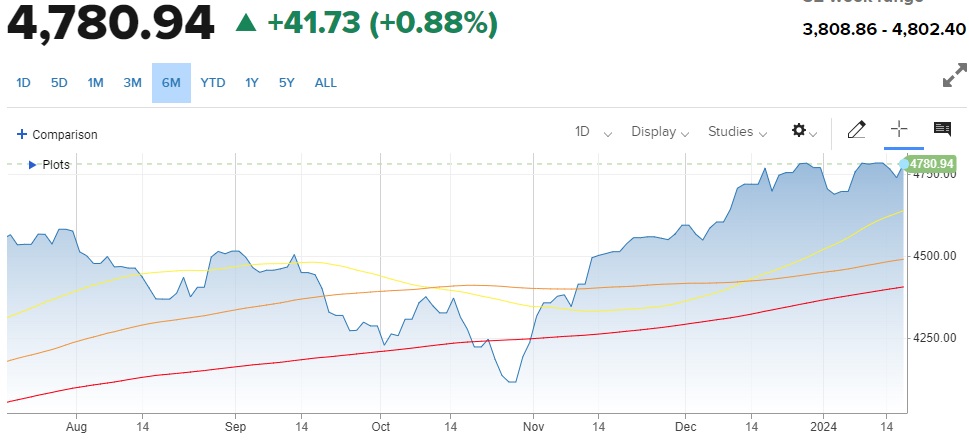
Moving Averages: 50 Day (yellow), 100 Day (orange), 200 Day (red)

A break below 4,600 is unlikely without some greater fundamental concerns arising. But let’s do appreciate the 2 next levels of price support rest at 4,488 for 100 day moving average and about 4,400 for the 200 day moving average.

Your trading plan should be to stay bullish. Use any subsequent pullback as a buy the dip opportunity. NOT for the stocks that led the charge in 2023. That game plan is played out.

Instead valuation and quality will be held in higher regard this year as the overall PE of the market is not cheap. GAARP is fine (Growth At A Reasonable Price)…but not growth at ANY price like last year.

If you want my favorite stock ideas for 2024, then read on below…

What To Do Next?

Discover my current portfolio of 11 stocks packed to the brim with the outperforming benefits found in our exclusive POWR Ratings model.

Yes, that same POWR Ratings model generating nearly 4X better than the S&P 500 going back to 1999.

Plus I have selected 2 special ETFs that are all in sectors well positioned to outpace the market in the weeks and months ahead.

These 13 top trades are based on my 43 years of investing experience seeing bull markets…bear markets…and everything between.

If you are curious to learn more, and want to see these lucky 13 hand selected trades, then please click the link below to get started now.

Steve Reitmeister’s Trading Plan & Top Picks >

Wishing you a world of investment success!


Steve Reitmeister…but everyone calls me Reity (pronounced “Righty”)
CEO, StockNews.com and Editor, Reitmeister Total Return


About the Author

Steve is better known to the StockNews audience as “Reity”. Not only is he the CEO of the firm, but he also shares his 40 years of investment experience in the Reitmeister Total Return portfolio. Learn more about Reity’s background, along with links to his most recent articles and stock picks.

Quality Stocks In…Garbage Stocks Out!

Please enjoy this updated version of weekly commentary from the Reitmeister Total Return newsletter. Steve Reitmeister is the CEO of StockNews.com and Editor of the Reitmeister Total Return.Click Here to learn more about Reitmeister Total Return


SPY – Stocks keep flirting with the all time highs for the S&P 500 (SPY) and keep falling short. Meaning this is proving to be a stubborn level of resistance at 4,800. Why is that happening? And when will stocks finally break above? 43 year investment veteran Steve Reitmeister shares his view including a preview of his favorite stock picks now. Read on below for the answers…


As suspected, the market is not ready to make new highs above 4,796 for the S&P 500 (SPY).

That was quite evident Thursday as stocks jumped out of bed in the morning to touch those previous highs only to find stubborn resistance with the broad market heading lower from there.

Why are stocks struggling at this level?

And what is an investor to do about it?

The answers to those vital questions will be at the heart of today’s commentary.

Market Commentary

Some investment writers will have a fairly short hand, and highly inaccurate, way to describe what happened on Thursday.

They will tell you that the CPI inflation reading was hotter than expected on Thursday morning. And that caused the stock market sell off that followed.

That is simply not true.

Here is what really happened. The CPI report came out an hour before the market open. And yet still the market leapt higher out of the gate. But once it touched the hem of the previous highs (4,796) a more than 1% intraday sell off that ensued.

That pain is not so evident in the late session bounce and modest loss for S&P 500. Yet is a lot more apparent in the -0.7% showing for the small caps in the Russell 2000 on the session.

Thus, the problem for lack of further stock advance is not about CPI report. Just a statement that investors are not prepared to breakthrough resistance to make new highs.

So, what is holding stocks back?

I discussed that in greater detail in my last commentary: When Will the Bull Market Run Again?

The essence of the story is that investors have less clarity on the next moves for the Fed than they had after the November and December meetings that sparked a tremendous end of year rally. Unfortunately, there has been a mixed bag of inflation and economic data that calls into question when rate cuts will begin.

At the earliest those cuts could come at the March 20th meeting. But I sense that the more readings we get like Thursday’s CPI report, or last Fridays stronger than expected employment report…the more likely those first cuts get pushed off to either the May 1st or June 12th Fed meetings.

Digging into the CPI reading we find that inflation was expected to come in at 3.1% yet spiked to 3.4% on this reading. Core CPI was even worse at 3.9% year over year. Just still too far away from the Fed’s target of 2%.

For the “wonks” out there you should dig into the Sticky Price resources created by the Atlanta Fed. To put it plainly, sticky inflation remains too sticky. The main elements are housing and wages that are not coming down as quickly as expected.

When you appreciate the conservative nature of the Fed…and that they state over and over again that they are “data dependent”, then its hard to look at the recent data and assume they are ready to lower rates any time soon.

Long story short, I don’t think that investors are ready for the next bull run to make new highs until they are more certain WHEN the Fed will finally start cutting rates. That delays the next upside move to March 20th at the earliest with May or June becoming all the more likely.

Hard to complain about settling into a trading range for a while given the tremendous pace of gains to end 2023. So this seems like a reasonable time for stocks to rest before making the next big move.

The upside of the current range connects with the aforementioned all time high of 4,796…but really easier to think of the lid as 4,800.

On the downside, that is a bit harder to infer. Typically trading ranges are 3-5% from top to bottom. So, for quick math let’s say around 4,600 on the bottom. This also represents the previous resistance point that took a long time to finally break above in early December.

The good news is that I expect quality stocks to prevail even in a range bound market. Meaning that last year pretty much any piece of beaten down junk was bid higher. That party is OVER!

Instead, when you have a pretty fully valued market as we have now, then there will be a greater eye towards quality of fundamentals and value proposition. I spelled that out pretty completely in last week’s article: Is 2024 Prime Time for Value Stocks?

The answer to the question posed in the headline is…YES. Meaning that 2024 is lining up nicely for value stocks.

Case in point being the early results this year with our Top 10 Value strategy up +3.70% through Wednesday’s close vs. breakeven for S&P 500 and -2.80% for the small caps in the Russell 2000.

I strongly believe that edge for value will continue as the year rolls on. And the best way to take advantage of that is spelled out in the next section…

What To Do Next?

Discover my current portfolio of value stocks packed to the brim with the outperforming benefits found in our exclusive POWR Ratings model.

This includes direct access to our Top 10 Value Stocks strategy that is hot out of the gates in 2024 with plenty more room to run.

If you are curious to learn more, and want to lean into my 43 years of investment experience, then please click the link below to get started now.

Steve Reitmeister’s Trading Plan & Top Picks >

Wishing you a world of investment success!


Steve Reitmeister
…but everyone calls me Reity (pronounced “Righty”)
CEO, StockNews.com & Editor, Reitmeister Total Return


SPY shares were trading at $475.88 per share on Friday afternoon, down $0.47 (-0.10%). Year-to-date, SPY has gained 0.12%, versus a % rise in the benchmark S&P 500 index during the same period.


About the Author

Steve is better known to the StockNews audience as “Reity”. Not only is he the CEO of the firm, but he also shares his 40 years of investment experience in the Reitmeister Total Return portfolio. Learn more about Reity’s background, along with links to his most recent articles and stock picks.
Investor Alert: Hidden Gem for Stocks Found in Friday Report

Please enjoy this updated version of weekly commentary from the Reitmeister Total Return newsletter. Steve Reitmeister is the CEO of StockNews.com and Editor of the Reitmeister Total Return.Click Here to learn more about Reitmeister Total Return


SPY – Stocks have been pressing lower of late as the bond rates continue to rise. This had the S&P 500 (SPY) dangerously close to the 200 day moving average. Yet hidden in the Friday Government Employment report was a clue that sparked a rally and maybe puts an end to recent market weakness. Read on below for full details….

Right now the most important thing on investor’s minds is the dramatic rise in bond rates, and how that makes stocks less attractive. I tackled that subject pretty thoroughly in my previous commentary this week. Be sure it read now if you haven’t already:

When is the Stock Bouncing Coming?

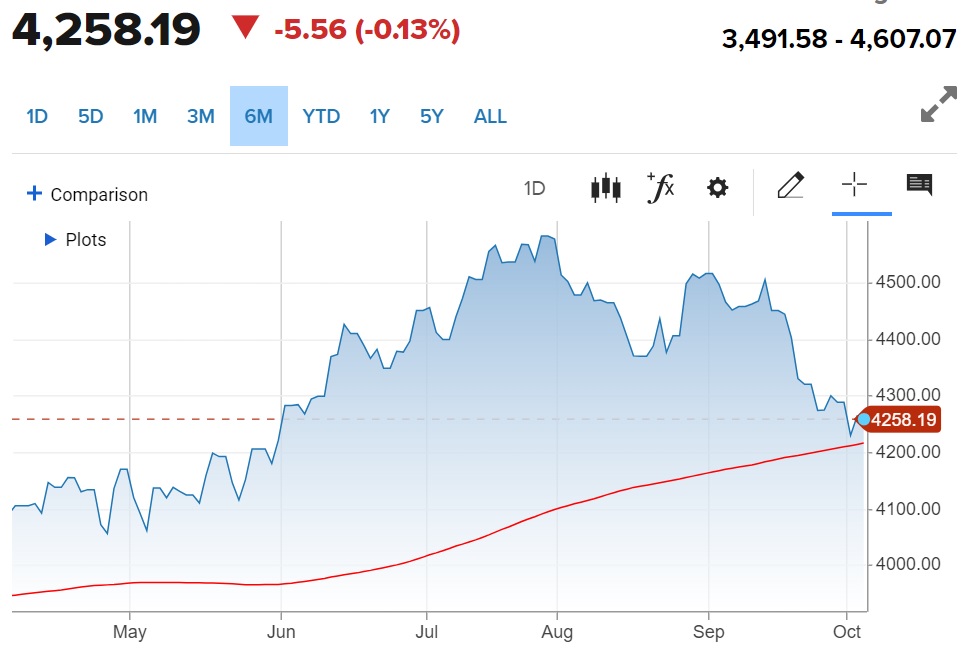
The quick answer to the above question, is that the bounce could be forming now as stock flirt with the 200 day moving average at 4,206 for the S&P 500 (SPY). That is the red line in the chart below.

On the fundamental front, if rates keep ripping higher, then it will only put more pressure on stock prices. I sense that 5% is a logical top for 10 year rates…but who says that the market is logical?

Also note on the fundamental end of things that the economic reports continue to come in positive. Even 20 months into the most aggressive Fed rate hiking regime in history, GDP estimates continue to be robust.

GDP Now has it their Q3 estimate all the way up to +4.9% bolstered by the most recent ISM Manufacturing report. Further, the Blue Chip Economist panel sees +2.9% as the more logical growth trajectory.

If I were to place a bet in Vegas I would say the Economists are much closer to the final number. Regardless, it is hard to look at these results and see a recession coming…and therefore it is hard to be truly bearish.

On top of that the Government Employment Situation report came out Friday morning much hotter than expected. Since so much of the initial market reaction is based on just reading the headline…then yes stocks sold off early in the session.

Gladly, as prudent investors dug into the details they discovered a hidden gem in the report. That being month over month wage inflation down to only 0.2% which means we are ebbing ever closer to the 2% inflation target for the Fed as this “sticky” form of inflation becomes unstuck at such high levels.

As this new spread…so too did the stock gains. As I put this commentary to rest with 90 minutes left in the Friday session we have a +1.4% result for the S&P 500 and nicely above recently resistance at 4,300.

Back to the big picture conversation about higher rates….

Yes, stock prices are down of late as “rates normalize” to more traditional historic levels. Meaning we are no longer enjoying the artificially low rates we that have been in hand the past 15 years.

Once everyone makes this adjustment to the new world view of rates…and realize the world is not falling apart…they will be compelled to put their money into the best stocks. And maybe Friday’s rally is an early sign of that taking place.

So, which are those best stocks, you ask?

Read on below for the answer…

What To Do Next?

Discover my brand new “2024 Stock Market Outlook” covering:

  • Bear Case vs. Bull Case
  • Trading Plan to Outperform
  • What Industries Are Hot…Which Are Not?
  • Top 11 Picks for the Year Ahead
  • And Much More!

Gain access to this vital presentation now by clicking below:

2024 Stock Market Outlook >

Wishing you a world of investment success!


Steve Reitmeister
…but everyone calls me Reity (pronounced “Righty”)
CEO, StockNews.com & Editor, Reitmeister Total Return


SPY shares were trading at $430.05 per share on Friday afternoon, up $5.55 (+1.31%). Year-to-date, SPY has gained 13.70%, versus a % rise in the benchmark S&P 500 index during the same period.


About the Author

Steve is better known to the StockNews audience as “Reity”. Not only is he the CEO of the firm, but he also shares his 40 years of investment experience in the Reitmeister Total Return portfolio. Learn more about Reity’s background, along with links to his most recent articles and stock picks.
When is the Stock Bounce Coming?

Please enjoy this updated version of weekly commentary from the Reitmeister Total Return newsletter. Steve Reitmeister is the CEO of StockNews.com and Editor of the Reitmeister Total Return.Click Here to learn more about Reitmeister Total Return


SPY – Higher bond rates have been the main catalyst behind lower stock prices. Yet with the S&P 500 (SPY) pressing down towards the 200 day moving average we are all wondering when stocks will finally bounce. Steve Reitmeister reviews the facts in hand to help investors navigate the choppy investment waters. Read on below for the full story…

In last week’s commentary I focused on the following relationship:

Rates Up > Stocks Down

Now everyone is quite aware of this dynamic explaining the continued pressure on stock prices with the S&P 500 (SPY) at the lowest level in months.

However, what remains unclear to most is… WHY it this happening…and how much higher could rates go?

That will be the focus of this week’s Reitmeister Total Return commentary.

Market Commentary

The reason for higher long term bond rates is quite simple…and actually has nothing to do with current inflation issues which are likely to fully moderate in the coming 12-24 months. What this boils down to is the following term that you will see more and more:

Rate Normalization

Meaning that rates have been “abnormal” ever since the Great Recession as the Fed used every tool imaginable to crush interest rates to reinvigorate the economy. The ante got upped during Covid with rates tumbling down to a historic low of 0.5% for the 10 year Treasury.

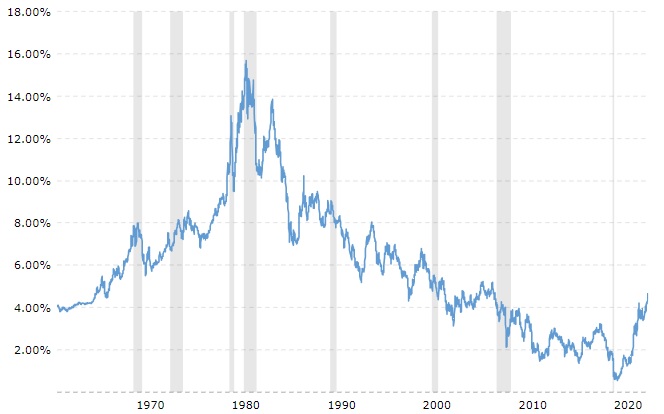
Let’s review this 60 year chart to appreciate the trends over the years:

There really have been 2 abnormal periods in history. We just spoke about rates tumbling to all time lows after the Great Recession through Covid (2008-2020).

Now check out the spike in rates during the hyper-inflation period of the late 1970’s. This peaked in 1982 thanks to the hard work of then Fed Chair Volker.

So what are normal rates for the 10 year Treasury?

There is some debate, but most say 4.5% to 5%.

Where are we today? Smack dab in the middle at 4.79%.

Yes, that is much higher than recent memory…but not really high in the grand scheme of history. And thus not necessarily a reason for the economy to come to a screeching halt and thus not a reason to flee stocks in the long run.

Yet in the short run, some adjustments to investment portfolios have to be made. For example, with yields this high we all can get a decent rate of return with bonds and money market accounts without taking any real risk. This is having more money flowing out of stocks towards bonds.

That is not a brand new phenomena as bond fund flows have been very positive since late 2022. The greater question now is when will we hit peak rates…and thus when will the stock market carnage end?

If you line up 10 investment experts, they will give you 10 different opinions. Because to be honest, 90% of them didn’t really see this coming. And thus cant give a straight answer on how/when it ends.

That is why I thought valuable to draw back to the picture of the historical rates. When you remove the abnormal highs and lows you find that we are pretty close to normal. So, it is fair to imagine that 5% could present a reasonable near term top for rates.

Unfortunately…who says that the market is rational?

The bond market gets hit with waves of fear and greed just like the stock market. And thus we could easily go well past 5% bond rates before things correct back to normal levels. And yes, that would be bad for stock prices.

Truly we are at a critical juncture. Not just about the direction of bond rates, but also stocks are on closing in on the most important technical level. More on that in the next section.

Price Action & Trading Plan

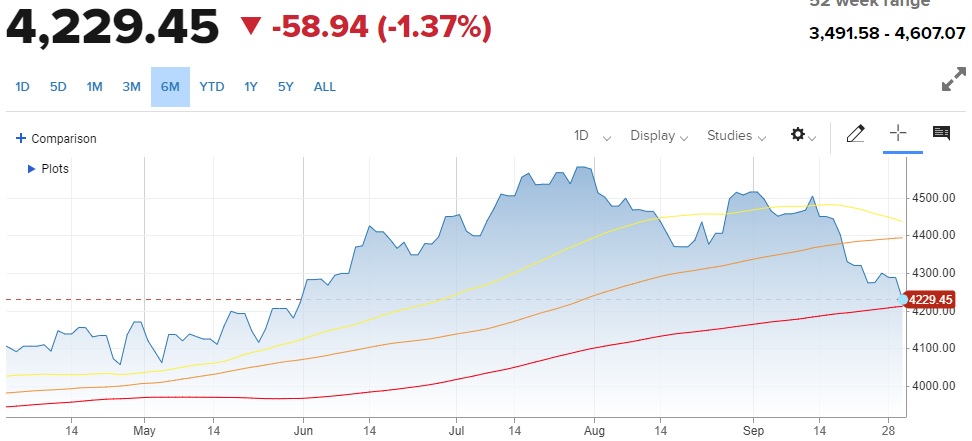
Moving Averages: 50 Day (yellow), 100 Day (orange), 200 Day (red)

There is no way to paint this picture in a positive light. As you can see, this past month stocks have broken down past support at the 50 day and 100 day moving averages. So obviously now we are all wondering how well the 200 day moving average will hold up at 4,202.

Personally, I like the odds of seeing solid short term support at this level. BUT if the 10 year Treasury rates start raging above 5%…then I suspect stocks will spend some time below the long term trend line only adding to recent negativity.

As for our trading strategy, we are 100% invested and have taken advantage of the recent dip to add stocks & ETFs that should excel when a bounce finally ensues. But a serious break below the 200 day moving average would have me consider more conservative measures. Like perhaps retreating to 70-80% long.

Why not more conservative or even bearish?

Would need to see more serious reason to believe in a recession forming that would provide a fundamental reason for extended stock downside. OR a deeper break under the 200 day that would have to be heeded in our strategy.

Either one of these would have use getting less long stocks…and potentially buying inverse ETFs to profit from downside.

Hard to explain why…but I have little fear of that at this moment. And just sense a bounce should soon be in hand with the picks in our portfolio leading the parade higher.

What To Do Next?

Discover my brand new “2024 Stock Market Outlook” covering:

  • Bear Case vs. Bull Case
  • Trading Plan to Outperform
  • What Industries Are Hot…Which Are Not?
  • Top 11 Picks for the Year Ahead
  • And Much More!

Gain access to this vital presentation now by clicking below:

2024 Stock Market Outlook >

Wishing you a world of investment success!

About the Author

Steve is better known to the StockNews audience as “Reity”. Not only is he the CEO of the firm, but he also shares his 40 years of investment experience in the Reitmeister Total Return portfolio. Learn more about Reity’s background, along with links to his most recent articles and stock picks.

2024 Stock Market Outlook

Please enjoy this updated version of weekly commentary from the Reitmeister Total Return newsletter. Steve Reitmeister is the CEO of StockNews.com and Editor of the Reitmeister Total Return.Click Here to learn more about Reitmeister Total Return


SPY – The time to think about the 2024 stock market is now. Will it be a bull or bear? Where does the S&P 500 (SPY) end the year? And what are the top picks to outperform? Investment veteran Steve Reitmeister does his level best to answer all these questions. Just read on below…


Tell me if you see the pattern…

2019 Bull Market

2020 Bear Market

2021 Bull Market

2022 Bear Market

2023 Bull Market

Given the above, the logical question on everyone’s mind should be…Will the bear market come back again in 2024?

This led to me record a brand new presentation this week that covers vital topics including:

  • Bear Case
  • Bull Case
  • And the Winner Is???
  • Trading Plan to Outperform
  • Top 10 Picks Right now
  • Pick #11 Coming Monday Morning
  • And Much More!

Gain access to this vital presentation now by clicking below:

2024 Stock Market Outlook >


Let me pull back the curtain on this presentation just a little more so you can appreciate why now is the perfect time to watch this presentation…

The goal was to give you a running head start to outperform in the year ahead.

If it sounds early to do that now please realize that most of the market is run by institutions. And they plan out several months in advance.

So if you are not thinking of 2024 right now…you are behind the curve.  

First off, we need to settle the bull vs. bear debate.

Will it follow the on/off pattern of the last few years?

Or will new market dynamics create a shift in the outcome?

And where does the S&P 500 (SPY) end up by years end?

The Fed is most certainly a big part of that market outlook equation. And to be honest, it has become a more complicated riddle of late…but solving that puzzle is truly the key to outperformance in the year ahead.

Next up we need to review which stock groups are likely to lead the way:

  • Large Caps vs. Small Caps?
  • Growth or Value Stocks?
  • Tech Still in Charge…Or Time for Others to Shine?

Considering the above led me to my current portfolio of 11 hand selected trades (4 ETFs and 7 stocks focused on the groups most likely to outperform).

All this and more awaits you in my new presentation. So please click below to start watching now:

2024 Stock Market Outlook >

Wishing you a world of investment success!

Steve Reitmeister
…but everyone calls me Reity (pronounced “Righty”)
CEO StockNews.com & Editor of Reitmeister Total Return


About the Author

Steve is better known to the StockNews audience as “Reity”. Not only is he the CEO of the firm, but he also shares his 40 years of investment experience in the Reitmeister Total Return portfolio. Learn more about Reity’s background, along with links to his most recent articles and stock picks.