Following the global pandemic, the healthcare sector is finding new avenues and accelerating diversification strategies to drive growth. Moreover, the healthcare industry has an aging population in its favor. The median human age in 2022 is 30.2 years compared to 20.6 years in 1974.
Many countries have launched policies to fix the aging population and stagnation challenges.
With a market capitalization of $259.40 billion, healthcare stalwart Merck & Co., Inc. (MRK) continues strengthening its pipeline through trials, approvals, and collaborations. KEYTRUDA, an oncological drug, primarily drove the company’s business momentum.
Additionally, the company is looking to bolster its oncological pipeline. Last month, MRK and Moderna, Inc. (MRNA) announced that MRK had exercised its option to jointly develop and commercialize a personalized cancer vaccine (PCV). The costs and profits of this collaboration are expected to be shared by the companies.
On top of that, in September, MRK’s Animal Health segment acquired Vence, a virtual fencing innovator for rotational grazing and livestock management, thereby broadening its portfolio.
The company has also raised its expected full-year 2022 worldwide sales to a range of $58.5-$59.0 Billion, reflecting a growth of 20-21%. The company also raised its full-year 2022 non-GAAP EPS outlook to a range of $7.32-$7.37.
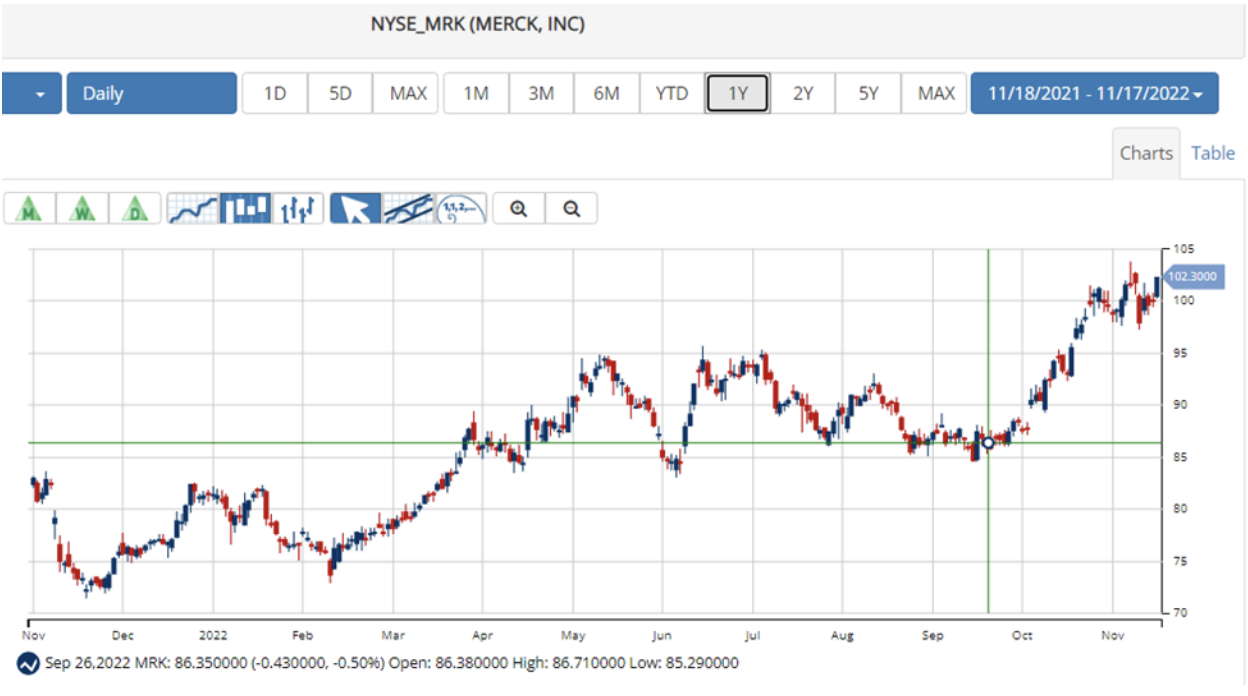
The stock has gained 23.9% over the past year and 33.5% year-to-date to close its last trading session at $102.31. It has gained 8.7% over the past month and is trading higher than its 50-day and 200-day moving averages of $92.71 and $87.87, respectively.
Here are the factors that could influence MRK’s performance:
Sound Financial Growth
For the fiscal third quarter of 2022, MRK’s sales increased 14% year-over-year to $14.96 billion. Excluding certain items, its non-GAAP net income and non-GAAP EPS came in at $4.7 billion and $1.85, respectively, up about 4% from their year-ago values.
Growth in oncology was driven by revenues from KEYTRUDA, which increased approximately 20% from the prior-year period to $5.43 billion, while growth in vaccines was mainly due to higher GARDASIL / GARDASIL 9 sales, which grew 15% year-over-year to $2.29 billion.
Discounted Valuation
In terms of its forward P/E, MRK is trading at 17.21x, 31.7% lower than the industry average of 25.21x. The stock’s forward non-GAAP PEG multiple of 1.36 is 24.8% lower than the industry average of 1.80.
In terms of its forward EV/EBIT, the stock is trading at 12.16x, 30.6% lower than the industry average of 17.52x. Its forward Price/ Cash Flow multiple of 13.05 is 21.2% lower than the industry average of 16.56.
Strong Past Growth
MRK’s revenue grew at an 8.7% CAGR over the past three years and an 8.2% CAGR over the past five years. In the last three years, its EBIT and net income grew at CAGRs of 10.7% and 17.9%, respectively. Its EPS also increased at an 18.8% CAGR over the same period.
Favorable Analyst Estimates
The consensus EPS estimate for the current year (fiscal 2022) of $7.38 indicates a 22.6% year-over-year improvement. Likewise, the consensus revenue estimate of $59.11 billion for the same year reflects a rise of 21.4% from the prior year. Moreover, analysts expect MRK’s EPS to grow 11.1% per annum over the next five years.
Attractive Dividend Growth
In July, MRK declared a dividend of $0.69 per share of the company’s common stock for the fourth quarter of 2022. Its annual dividend of $2.76 yields 2.7% on the current share price. It has a four-year average yield of 2.95%.
The company’s dividend payouts have increased at a 9.6% CAGR over the past three years and a 9% CAGR over the past five years. The company grew its dividend payments for 11 consecutive years.
Technical Indicators Look Promising
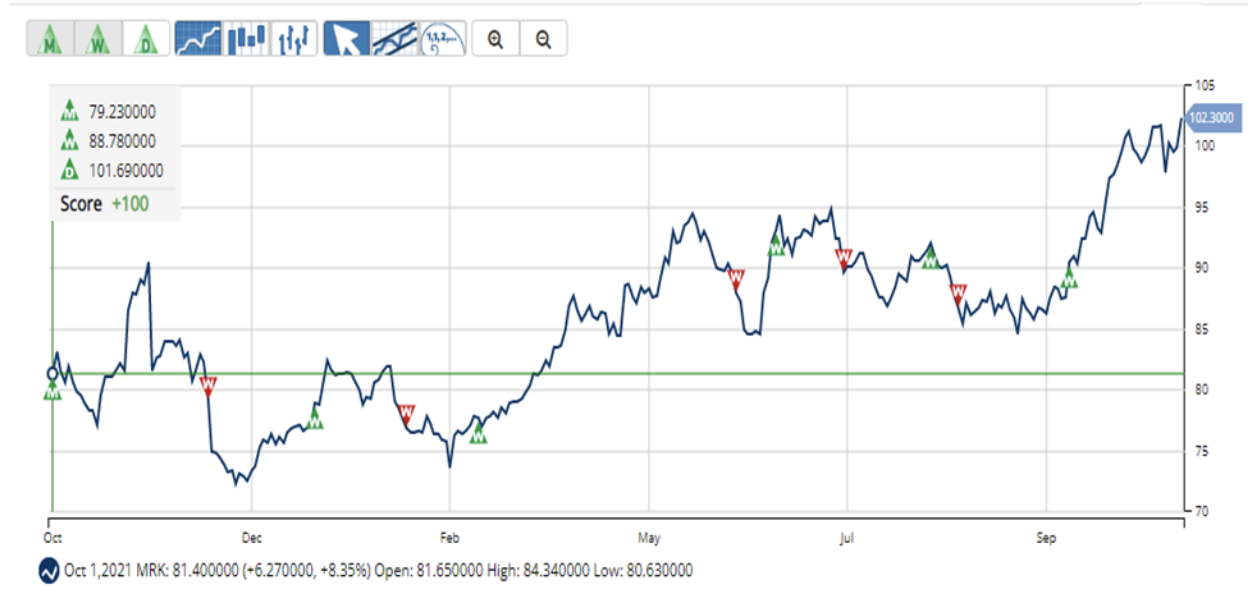
MarketClub’s Trade Triangles show that MRK has been trending UP for all three-time horizons. The long-term trend has been UP since October 1, 2021, the intermediate-term trend has been UP since October 10, 2022, and the short-term trend has been UP since November 17, 2022.
The Trade Triangles are our proprietary indicators, comprised of weighted factors that include (but are not necessarily limited to) price change, percentage change, moving averages, and new highs/lows. The Trade Triangles point in the direction of short-term, intermediate, and long-term trends, looking for periods of alignment and, therefore, strong swings in price.
In terms of the Chart Analysis Score, another MarketClub proprietary tool, MRK scored +100 on a scale from -100 (strong downtrend) to +100 (strong uptrend), indicating that the stock is in a strong uptrend which is likely to continue. Traders should protect gains and look for a change in score to suggest a slowdown in momentum.
The Chart Analysis Score measures trend strength and direction based on five different timing thresholds. This tool considers intraday price action; new daily, weekly, and monthly highs and lows; and moving averages.
Click here to see the latest Score and Signals for MRK.
What's Next for Merck & Co., Inc. (MRK)?
Remember, the markets move fast and things may quickly change for this stock. Our MarketClub members have access to entry and exit signals so they'll know when the trend starts to reverse.
Join MarketClub now to see the latest signals and scores, get alerts, and read member-exclusive analysis for over 350K stocks, futures, ETFs, forex pairs and mutual funds.
Best,
The MarketClub Team
su*****@in*.com


