If It Walks Like A Duck, Quacks Like A Duck, It's A Duck!

Hello MarketClub members everywhere! As the month of February rapidly comes to an end in just three trading days, I thought it would be interesting to look at where the markets closed at the end of January, which as you know was a very volatile month.

So here the closing values of the major indices, gold and crude oil on January 29th: Continue reading "If It Walks Like A Duck, Quacks Like A Duck, It's A Duck!"

Get Ready For A Buying Opportunity In Gold

Hello MarketClub members everywhere!

Gold

Is this pullback in gold a buying opportunity or a watching opportunity? I think it's the latter, and here are the reasons why.

Gold (FOREX:XAUUSDO) has had a remarkable rally from early December in 2015 to just a couple of weeks ago when the price of gold peaked at $1260 in the spot market. There are two things that I'm looking at in this market; one is for further consolidation and the second is that I believe that a major cyclic low will be occurring in the near future.

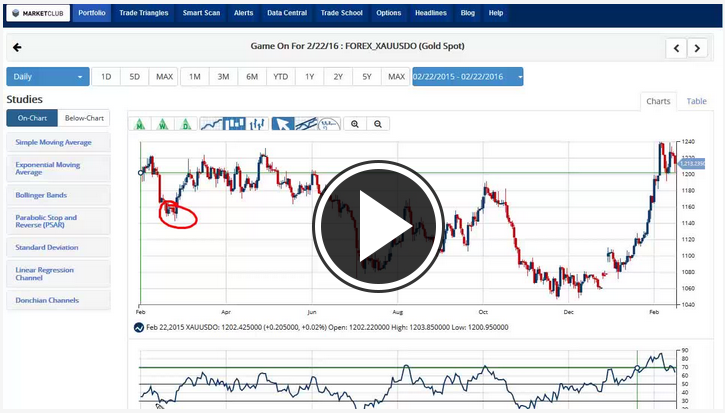
Looking at a chart of gold for the past 12 months you can see that gold had low periods in March, July and December. If that same rhythmic pattern holds true, the next low period should be coming up in April. I expect to see gold remain choppy until that time period.

The major reason why I want to pay close attention to gold is that I believe it is in a longer-term bullish cycle. One area to pay close attention to is the 50 support line on the RSI indicator. You also want to pay particular attention to the monthly RSI, which still remains below the 50 line indicating that it's not fully into a strong upward momentum cycle for gold. I believe that we will see further consolidation below the RSI line before it's broken on the upside. Continue reading "Get Ready For A Buying Opportunity In Gold"

It's Not Over Until It's Over And It's Not Over Yet - Part 2

Hello MarketClub members everywhere! Well, today's sharp drop in equity prices and the rally in gold should come as no surprise as I have been talking about this since the beginning of the year. In fact, here's my first post where I explained why I thought the bear market was going to continue in the equities market. I'm not going to go over the reasons again as to why the markets are going down, suffice to say they are going down and are likely to continue.

At the moment all of the central banks, including the Fed, are clueless as to what to do. Instead of spending time on a cure in 2008, we made it easy for everyone to "take a pill" and mask over the problem. Since it did not cure the problem, we all have to suffer now as the markets readjust and face the music. The new hard reality is that there is no wonder pill.

Let's take a look at the major indices and see how far they could fall based on Fibonacci retracement levels and technical measurements. Continue reading "It's Not Over Until It's Over And It's Not Over Yet - Part 2"

Using Fibonacci Symmetry To Layout Your Trading Battleplan

Are you under the assumption that if a trading plan is not an A+B=C, formulaic approach then it's useless? Join me in this 6-minute video as I explore a subjective approach to the markets used by some of the greatest living traders. I'll show you that interpreting data and making the best possible decision is your primary goal in trading. And if a plan goes wrong, and many times it does, how to lay out a contingency plan to protect your capital.

Using the tools of the wave principle and Fibonacci I analyze the NASDAQ 100. Specifically, I look at symmetry at work in the markets and how to act right now.

Learn more about TradingAnalysis.com here.

Plan Your Trade, and Trade Your Plan,
Todd Gordon

Crude Oil Crashes Through $30 And The Market Follows

This is turning out to be a very expensive week for investors who are still holding long positions in this market. As I warned late last year and all this year, I felt the market was and is going to be volatile and more than likely going lower.

Let's go back several years to the first quarter of 2009 when the equity markets bottomed out and began their six-year climb to the stars.

If you look at the S&P 500, you can see that it made a low on the week of March 2, 2009 at 683.38. Six years later on the week of July 13th it closed at a high of 2126.64. I want to look at the market using the Fibonacci tool and see potentially where this index might be headed on the downside. A classic 38.2% Fibonacci retracement takes this index back to 1,574, (it closed at 1,921.84 yesterday). A 50% retracement would bring the S&P 500 back down to 1405.51 and a 62% retracement would take it all the way back down to 1236.24.

The S&P 500 closed last Friday at 1922.03 Continue reading "Crude Oil Crashes Through $30 And The Market Follows"