If This Same Pattern Repeats, Watch Out!

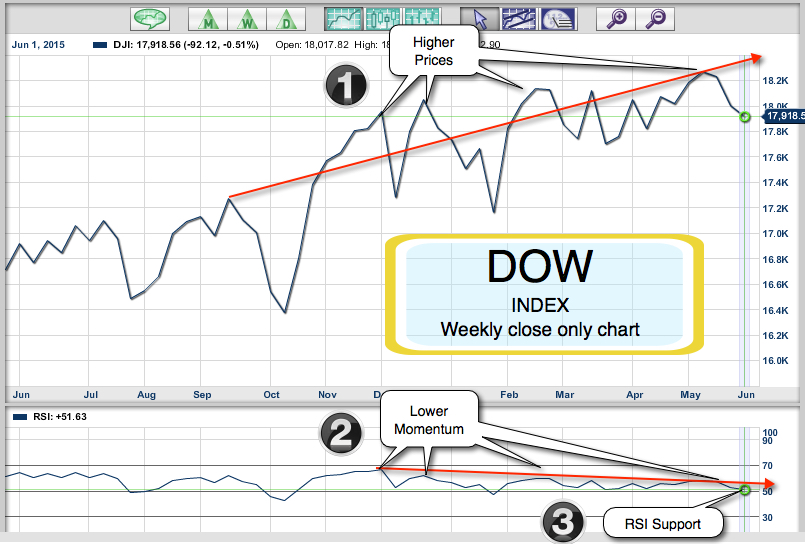
For the past nine weeks, the Dow and S&P have been repeating a pattern that if repeated this week, will spell trouble for the markets. The market has been going up and down in a somewhat regular fashion. If you look at a weekly chart of the Dow and S&P, you can see that they have not had two consecutive weeks closing in the same direction, either on the downside or the upside.

Last week we saw the indices close higher for the week and if the pattern repeats, this should be a down week with a lower weekly close.

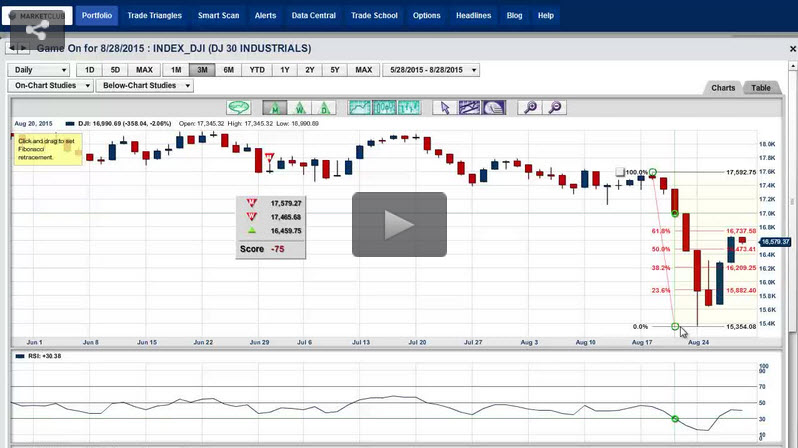
Here are the key levels to watch today. Should these levels be broken, I would expect the markets to accelerate to the downside. Continue reading "If This Same Pattern Repeats, Watch Out!"

It's Friday And Things Could Get Ugly

Even before the announcement of non farm payrolls, which is one of the most significant data releases of the summer, the markets were on the decline. One of the reasons for that has to be yesterday's market action, all the indices fell from their best levels of the day and closed at or close to the lows.

Yesterday's close in both the Dow and the S&P 500 was on target to be the lowest Friday close if nothing happened today. The fact that we are down sharply this morning is a huge negative in my book, but is not one that is surprising.

As we go into the long Labor Day weekend look for the markets to be very thinly traded and volatile. I'm looking for a new low Friday close today. The lowest most recent Friday close was 16,559.75 on the Dow and 1,970.89 on the S&P 500. The NASDAQ was the only index to remain above its lowest Friday close yesterday by just a few points. The level to watch in the NASDAQ is 4,717.16, that level represents the lowest most recent close on a Friday. Continue reading "It's Friday And Things Could Get Ugly"

Choppy Action and a Dead Cat Bounce

This week has been one for the history books and it's not over with yet, we still have today's action to contemplate. So what has the market really accomplished this week? Well, it has frustrated both the bulls and the bears, that's for sure. It's hard to believe that after all of this chop that the Dow is only up 1.18% for the week if it closes where it is currently trading (and less than that on the S&P 500).

What does all of this choppy action mean? Has the market topped out? Is this a "dead cat bounce"?

Let's just let all the dust settle and see what is going on in the major indices for the week and the month.

Last week the major indices closed at: Continue reading "Choppy Action and a Dead Cat Bounce"

Optimism For Greece - Can It Last?

It started in the Far East and was immediately picked up by the European stock markets with many of them soaring over 3% for the day. All of which was overshadowed by the Athens Stock Index which was up over 8%. Can anyone say happy days are here again?

It would appear to this observer that the world wants a positive outcome from this self-induced Greek tragedy.

Last week, on Thursday to be exact, you may remember buy signals were triggered on the S&P 500 and the NASDAQ based on the Trade Triangle technology. That signal did not apply to the Dow which remains a laggard. The Dow could join the S&P 500 and the NASDAQ should it trade above 18,169 this week. As of this writing, the DOW is about 30 to 40 points away from giving a buy signal based on the Trade Triangle technology. Continue reading "Optimism For Greece - Can It Last?"

Is This The End Of The Bull Market?

Today I'm going to be analyzing charts of the DOW, NASDAQ and the S&P500 and the potential divergence I see in those markets.

It's too early to tell if these markets are going to reverse down and calling tops is never easy, nor am I trying to do that in this particular posting. What I am doing, however, is bringing to your attention a potential problem and a potential opportunity.

What I mean by that somewhat contradictory statement is that these markets could go either way. However, the odds would still favor trading with the trend and the major trend in both the DOW, NASDAQ and the S&P500 continues to be to the upside.

INDEX:DJI

In the three charts I have laid out today you can see the #1 and #2 quite clearly. #1 indicates that prices are going higher and #2 indicates that momentum is not following prices. This could be an early warning sign that things aren't quite up to par and as strong as I would like to see. Continue reading "Is This The End Of The Bull Market?"