This, the second part of our Silver research article suggesting Silver may be forming a massive price base in preparation for an explosive upside move, will continue from Part I of this research series.
Our research team believes Silver is setting up in a price pattern that may already be “ripe” for an explosive upside move. Our researchers have poured over the data and believe the disparity between Gold and Silver is already at excessive levels.
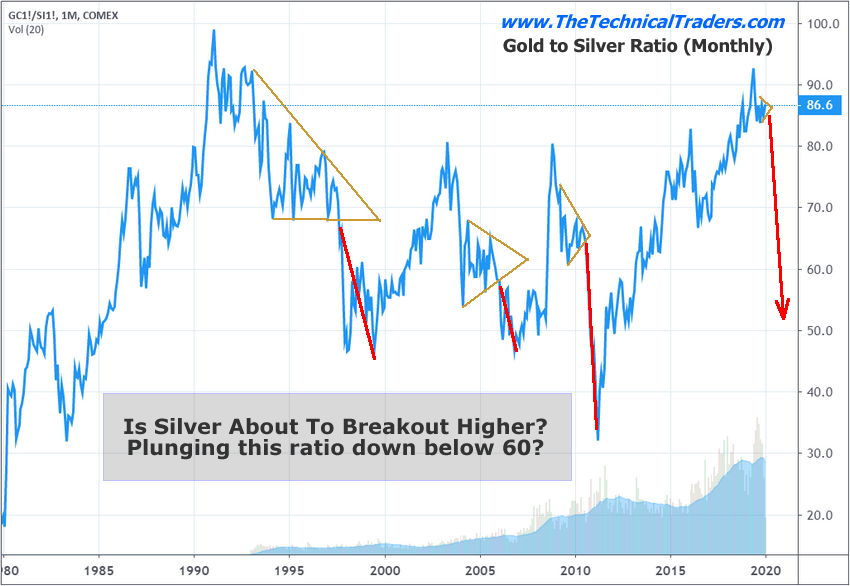
Historically, anytime the disparity between Gold prices and Silver prices (rationalized into comparative Gold price levels) breaches 30% to 60% and Gold begins an upside price advance, Silver typically begins to move higher with 4 to 8+ months. This setup pushes the Gold to Silver ratio back below 50 or 60 as Silver rallies substantially higher, and faster than the price of Gold.
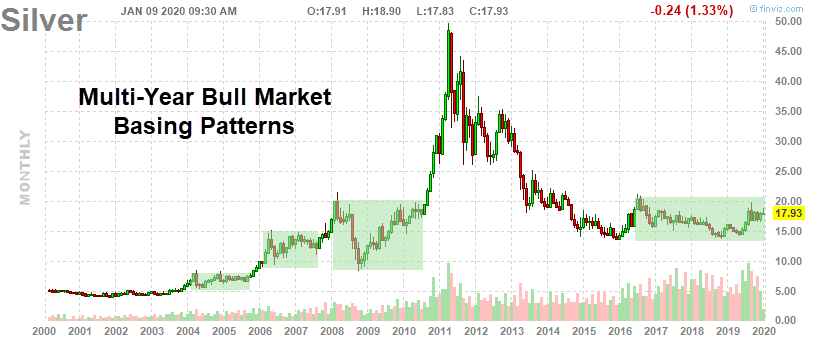
Comparatively, Silver continues to trade within a sideways price range after basing in early 2016. This price range has been fairly consistent between $14.50 and $21.0. With Gold recently starting to move higher because of the US/Iran military conflict, this raises an early warning flag for our research team because Silver has continued to trade below $18 – and well below recent highs near $20.
The price disparity between Gold and Silver is currently greater than 200% based on our proprietary modeling system. Remember, anytime this disparity level is greater than 30% to 60% and Gold breaks out in a rally, Silver will break to the upside within just a few months.

The second stage rally in Silver, the real money-maker, will come when investors pile into Silver and Silver Miners as the breakout in Silver becomes explosive. The time to get into this trade is/was now or 4 months ago. Still, there is plenty of opportunity for skilled traders right now because the breakout move in Silver and Silver Miners has not really begun yet. Continue reading "My Big Trend Analysis For Silver Investors - Part 2" →


