Are Stocks Ready to Make New Highs?

Please enjoy this updated version of weekly commentary from the Reitmeister Total Return newsletter. Steve Reitmeister is the CEO of StockNews.com and Editor of the Reitmeister Total Return.Click Here to learn more about Reitmeister Total Return


SPY – The recent sell off is over for the stock market…but are stocks really ready to make new highs above 4,600 for the S&P 500 (SPY)? 43 year investment veteran Steve Reitmeister shares his latest market outlook, trading plan and top picks in this fresh commentary below…


It’s been a couple weeks since my last commentary thanks to a much enjoyed vacation. Gladly most of that time stocks were in the plus column as the market rightfully bounced from recent weakness.

This fits in with my theory that we will be playing around in a trading range for a while. 4,600 for the S&P 500 (SPY) being the top end of the range and 100 day moving average (currently at 4,337) framing the bottom.

How long will we be in the range?

And what will be the catalyst to finally break out of the range?

And what are the best trades for this market environment?

Those key questions and more will be explored in this week’s Reitmeister Total Return commentary.

Market Commentary

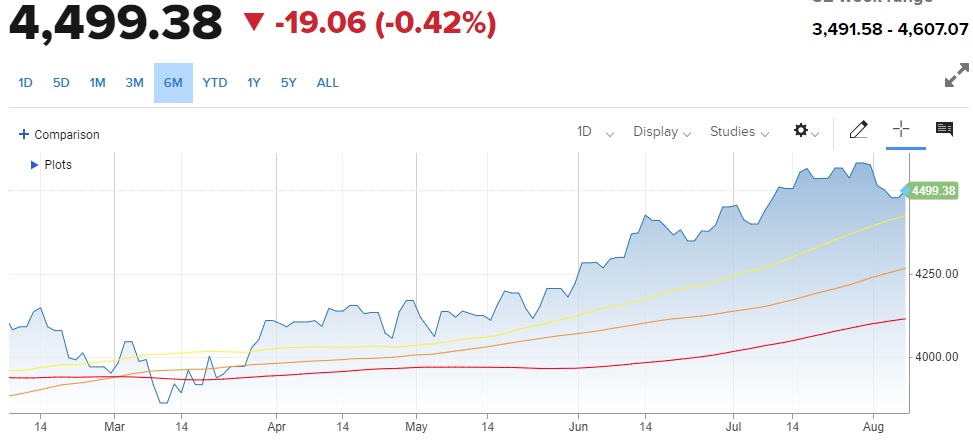
As expected, the early August downturn was nothing more than a healthy round of profit taking after the tremendous bull run that started in March. Thus, after seeing a fairly customary 5% pullback investors were ready to hit the buy button again pushing stocks the S&P 500 higher.
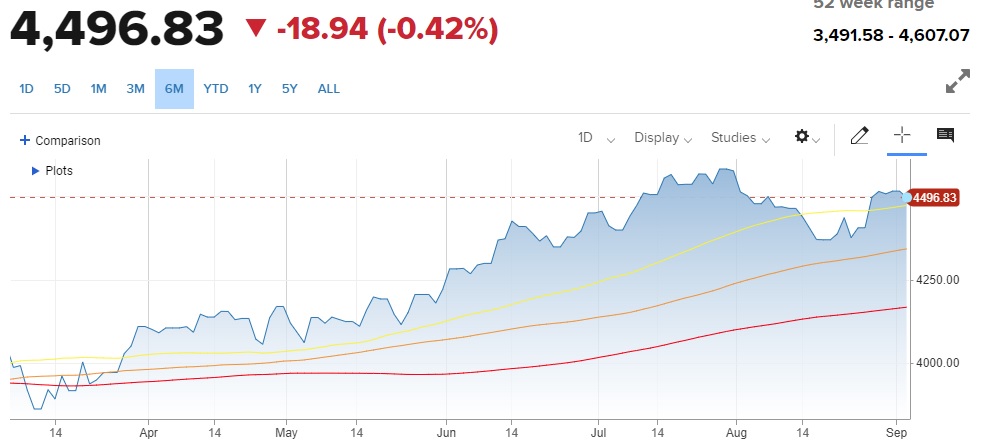
Moving Averages: 50 Day (yellow), 100 Day (orange), 200 Day (red)

The recent bounce is nice…but are investors truly ready to break out of the range and make news highs above 4,600?

I believe the answer lies in a review of the recent slate of economic events. This should tell us if we have the proper catalysts in place to race to new heights:

8/25 Jay Powell @ Jackson Hole:  Remember that last time in 2022 Powell scared the pants off investors with his hawkish rhetoric. The key line being to expect economic pain (recession and job loss) before their war on inflation was over. This led to stocks going on a severe two month sell off to bear market lows in October 2022.

This time around Powell gave the usual sound bites. Inflation is too high…more work to do…may need to raise rates.

At first, investors were still in correction mode and hung on the words about “may need to raise rates”. This initially put some red arrows on the board. But as the day progressed investors realized that it was truly no different than any speech given by the Fed in the last several months. From there stocks leapt higher and have not looked back.

9/1 Government Employment Situation: Pretty much right on the money at 187K jobs added. The big surprise was how the unemployment rate unexpectedly jumped from 3.5% to 3.8% as the participation rate also went up. The best part of the report was that wage inflation continues to moderate with a lower than expected +0.2% month over month increase (that is only about 2.4% annualized…not far off the Fed’s target).

This all fits in with the narrative that the Fed is making serious headway with inflation and that more rate hikes are likely not needed. The bigger question is when rates can start to head lower. They say that is a 2024 issue…perhaps true. But it is still possible to start in late 2023. Either way it was welcome news to stocks that rallied hard on this news to end a strong week of price action.

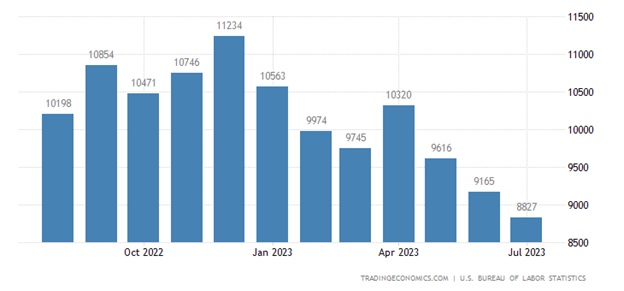
Note that back on 8/29 the JOLTs report gave clues that the jobs market is softening with fewer and fewer job openings (see chart below). This trend also speaks to the likelihood of moderating wage growth which is one of the stickier parts of the inflation picture.
9/1 ISM Manufacturing: This has been the weakest part of the economic picture with 9 straight readings under 50. Make that 10 months now with the 47.6 reading. Gladly that is the 2nd straight month of improvement. Note the PMI version of this monthly report was even more optimistic.

And now a glimpse of the key reports that lie ahead:

9/6 ISM Services: This is the larger, and healthier part of the economy where we got a 52.7 reading last month. Right now expectations call for a fairly similar reading of 52.4. Yet I suspect the strength of the most recent Retail Sales report may say there is some upside to that number.

9/13 Consumer Price Index (CPI): Investors like to focus on this inflation report even though the Fed has consistently said they find the Core PCE reading to be the much more reliable inflation indicator. Regardless, this has been trending nicely lower and mostly coming in under expectations for the past several months.

Too much focus is given to the year over the year # which has a lot to do with inflation many months ago. That is why experts like to drill down to the month over month readings which gives a sense of the current pace of things. That is expected to modulate to +0.2% which again is getting much closer to the Fed’s 2% annualized target. And will have folks readjusting odds for what happens  on the next item…

9/20 Fed Rate Announcement: Right now it’s a forgone conclusion the Fed will stay put on rates at this meeting. What is not as certain is whether they have one more rate hike up their sleeves…and when they finally start lowering rates as the longer they leave these restrictive policies in place…the more they risk a recession forming.

Right now the CME calculates 40% odds of 1 more hike by the end of the year (either at November or December meeting). Honestly, with the facts in hand, I don’t see that happening. The nails are already in the inflation coffin. Just better to apply some patience to see it through as Fed policy typically has 6+ months of lagged effects.

Expectations & Trading Plan

We are in a young bull market…but still not out 100% out of the woods. Meaning the Fed has a history of going too far with their policies thereby creating a recession.

I sense this group is wiser than some of their predecessors and will manage the soft landing from which they can lower rates…which will be an elixir for economic growth…earnings growth…and share price growth.

So for as positive as recent economic news has been, for right now I expect a bit more time in the aforementioned trading range (4,337 to 4,600). And that time will likely be volatile with no seeming direction. That is the very nature of trading ranges.

All you have to do is keep your eyes on the long term horizon which is bullish which gives you ample reason to load up on the best stocks now for WHENVER the catalysts come to push them higher. Meaning don’t stay on the sidelines any longer. The time to get on the bull train is now.

The next section will discuss a bit more about which are the best investments to stay a step ahead of the pack.

What To Do Next?

Discover my current portfolio of 7 stocks packed to the brim with the outperforming benefits found in our POWR Ratings model.

Plus I have added 4 ETFs that are all in sectors well positioned to outpace the market in the weeks and months ahead.

This is all based on my 43 years of investing experience seeing bull markets…bear markets…and everything between.

If you are curious to learn more, and want to see these 11 hand selected trades, then please click the link below to get started now.

Steve Reitmeister’s Trading Plan & Top Picks >

Wishing you a world of investment success!


SPY shares . Year-to-date, SPY has gained 18.36%, versus a % rise in the benchmark S&P 500 index during the same period.


About the Author

Steve is better known to the StockNews audience as “Reity”. Not only is he the CEO of the firm, but he also shares his 40 years of investment experience in the Reitmeister Total Return portfolio. Learn more about Reity’s background, along with links to his most recent articles and stock picks.

How to Play this Stock Market Dip?

Please enjoy this updated version of weekly commentary from the Reitmeister Total Return newsletter. Steve Reitmeister is the CEO of StockNews.com and Editor of the Reitmeister Total Return.Click Here to learn more about Reitmeister Total Return


SPY – Investing was a lot more fun during the non-stop rally between March and July. August has brought a long over due correction to the S&P 500 (SPY). The key for investors is figuring out when to buy this dip, and what are the best picks. Steve Reitmeister shares his thoughts including a preview of the 7 stocks and 4 ETFs he is recommending to investors now.


In my last market commentary, I talked about how stocks were falling short of regaining important ground above 4,400 for the S&P 500 (SPY).

Amazingly Wednesday we broke above with gusto…and then gave it all back and then some on Thursday closing at 4,376.

We will explore why this happened and where we head from here in the commentary below…

Market Commentary

The popular narrative for breaking back above 4,400 on Wednesday is that bond rates finally fell in a meaningful fashion from their recent peak. This improves the value equation for stocks with some hopes that this recent pullback was over.

Flash forward to Thursday. No news to speak of while bond rates were little changed. Stocks even started the session in the plus column. And yet tick by tick the gains frittered away leading to a dreadful -1.35% showing.

Not even beloved NVIDIA providing another breathtaking earnings beat could save the day. This begs the question…what the heck just happened?

The answer is: WELCOME TO THE NEW TRADING RANGE

Meaning 4,600 was too high for stocks. And the recent retreat nearer to 4,300 was too low. So now we are going to bounce around in a trading range for a while. This is not a surprise to anyone reading my recent commentaries citing that 4,600 was a bit too lofty given current fundamental conditions.

Trading ranges = erratic price action

That is because a new equilibrium has been established as investors await more clues that would have them become more or less bullish. But the vast majority of the time, the next move after a trading range is to get back to what you were doing before. In this case that means another leg higher.

The most important thing to appreciate about trading ranges is that pretty much all price moves inside the range are meaningless noise. As in, there may not be a logical reason. Case in point being the 1.35% haircut on Thursday.

Let’s get back to the conversation about government bond rates on the rise

There is a false narrative taking place on this vital topic. Some investment journalists are writing that it’s because investors see more long term inflation on the horizon. Yet most signs say that is not true.

Here is what I believe is taking place.

First, let’s step back to remember that since the Great Recession in 2008/2009 the Fed has used every tool necessary to lower rates. That includes Quantitative Easing that led to building a greater than $5 trillion portfolio of Treasury bonds.

That’s because less bonds on the free market = greater demand for the bonds left in circulation = lower rates on those bonds.

Now the Fed wants higher rates. And beyond the aggressive rate hike cycle for the Fed Funds Rate, they have been steadily selling off their bond portfolio (Quantitative Tightening). That leads to this equation:

More bonds on the free market = less demand for the bonds in circulation = rates need to rise to attract additional buyers.

Let’s also remember that the historical average for the 10 year Treasury rate is a little over 4% when the average inflation rate during those periods were a touch over 2%.

So perhaps all that is happening now with higher rates is that they are less manipulated by the Fed…and that they are returning to a true market rate.

That is also why I don’t think rates will go too much higher because looking out to the future inflation will get back to normal…and Fed funds rate will be lower…and thus bond rates will not need to be much higher than now.

Lastly, once the Fed wins their battle over inflation, they will lower the Fed funds rate which will allow the economy to grow faster. This equates to higher corporate earnings growth which is a much more natural catalyst for share price appreciation.

Putting it altogether, we are still in the midst of a new bull market…but one that got out of the gate a little too hot for the true state of the economic conditions. This leads to the trading range scenario we are in now.

We will break higher once investors are more convinced that the Fed has tamed inflation without causing a recession (aka Soft Landing). This tells everyone that rates will go lower in the future which is a green light for stock advancement.

Bottom Line: Buy the recent dip…and don’t sweat too much of the day to day volatility inside the trading range.

What To Do Next?

Discover my current portfolio of 7 stocks packed to the brim with the outperforming benefits found in our POWR Ratings model.

Plus I have added 4 ETFs that are all in sectors well positioned to outpace the market in the weeks and months ahead.

This is all based on my 43 years of investing experience seeing bull markets…bear markets…and everything between.

If you are curious to learn more, and want to see these 11 hand selected trades, then please click the link below to get started now.

Steve Reitmeister’s Trading Plan & Top Picks >

Wishing you a world of investment success!


SPY shares were trading at $441.03 per share on Friday afternoon, up $4.14 (+0.95%). Year-to-date, SPY has gained 16.19%, versus a % rise in the benchmark S&P 500 index during the same period.


About the Author

Steve is better known to the StockNews audience as “Reity”. Not only is he the CEO of the firm, but he also shares his 40 years of investment experience in the Reitmeister Total Return portfolio. Learn more about Reity’s background, along with links to his most recent articles and stock picks.
Who Wins the Battle Over 4,400?

Please enjoy this updated version of weekly commentary from the Reitmeister Total Return newsletter. Steve Reitmeister is the CEO of StockNews.com and Editor of the Reitmeister Total Return.Click Here to learn more about Reitmeister Total Return


SPY – How low will stocks go? That is the question on everyone’s mind as the recent highs for the S&P 500 (SPY) seem like a distant memory as stocks have been going the wrong direction for the entirety of August. Investment expert Steve Reitmeister the causes of the recent sell off plus a market outlook, trading plan and 11 top picks for the days ahead. Read on below for the full story…


There is no doubt a pullback is taking place as the S&P 500 (SPY) is a good spot off the recent highs found at the end of July. Since then, the large cap index has given back around 4% with small caps and other Risk On positions seeing even worse results.

The key questions at this time are: Where is bottom? And when will we get there?

We will explore these vital topics in this week’s Reitmeister Total Return commentary.

Market Commentary

We are going to tackle commentary in reverse order today…first explore the price action, then talk about the fundamentals driving price.

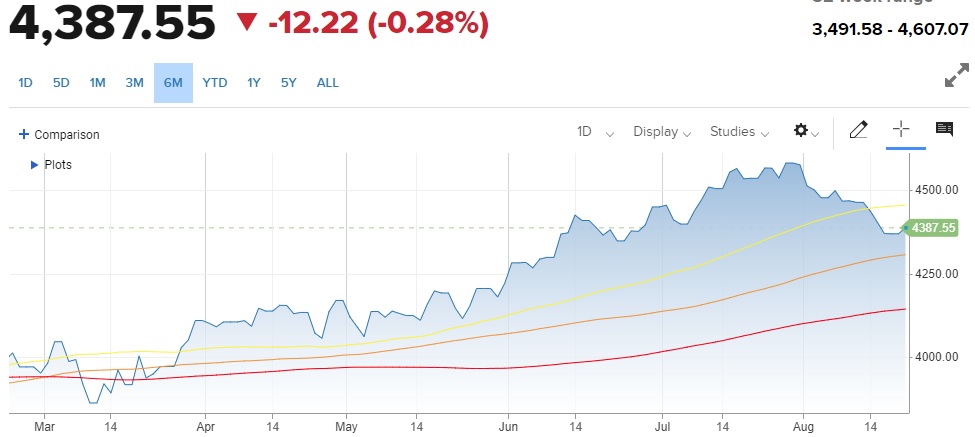
As noted above, stocks topped out near 4,600 at the end of July. Since then has been an ongoing process to find bottom:

Moving Averages: 50 Day (yellow), 100 Day (orange), 200 Day (red)

Stocks cut through the 50 day moving average like a hot knife through butter and have not looked back. Clearly a deeper wash out was needed given five straight months of excellent gains.

Next up we had psychological support at 4,400. That too did not hold. Then came up just short of breaking back above on Monday followed by another failed test on Tuesday.

That makes 3 straight closes below 4,400. This means we now likely have to contemplate whether the 100 day moving average at 4,305 will hold as support and bottom of the range. We got fairly close on Friday with an intraday strike down to 4,335 before a bounce ensued.

My gut tells me it wouldn’t take much to dive another 2% to test that 100 day moving average. That likely is as far as we need to go given the fundamental story in hand.

Meaning that a test of the long term trend line (200 day MA) at 4,136 seems likely overkill at this time. Probably the 100 day moving average is as far as we need to go.

Getting as low as the 200 day moving average is plausible ONLY if the economic events from here come in much worse than expected. Thus, a good time to switch to the fundamental picture of the market.

Fundamental Picture

My main thesis is that we have a long term bull market unfolding as the Fed does look on track with a soft landing as they bring inflation down to size.

DON’T thank the Fed…they have been doing their level best to create unemployment and a recession.

The main reason a recession has not unfolded…and likely won’t happen, is that the 2-4 million early retirees during Covid created an employment shortage. Anybody who wants a job can pretty much find one leading to historically low unemployment rate that has not buckled under the pressure of 1.5 years of intense rate hikes.

Unfortunately, this thesis includes the fact that bulls got way ahead of themselves bidding stocks up to 4,600 when the economy is still soft and earnings growth is non-existent. This led to an elevated PE over 20 which is too much weight for the current fundamentals to withstand.

The natural conclusion given above is to have a long overdue pullback that properly resets market equilibrium at a more logical valuation. This begets a trading range between likely the 100 day moving average at 4,305 and the previous high of 4,600.

This is a comfy trading range to play around in awaiting the next key catalysts to break out. Most likely that will be a break higher as the soft landing comes together allowing the Fed to lower rates which is strong caffeine promoting higher stock prices.

Yet while in the trading range we are very susceptible to every new headline that could make us go higher one day…and lower the next. So, let’s review the key economic events before us that could provide the next catalyst for the overall market:

8/16 FOMC Minutes: This happened last week. But an important piece of information to weigh against other events down the road.

The actual meeting on 7/25 the Fed clearly started their “dovish tilt”. That being the acknowledgement that inflation is moderating nicely. Plus, they no longer saw a recession unfolding before they were ready to lower rates. However, the meeting minutes had a bit more language about the “potential need” to raise rates further to put the final nails in the high inflation coffin.

Given that the market was already in the midst of a pullback, then this was just another reason to hit the sell button. Yet really, the language of the minutes was no more hawkish than any statement made by the Fed in the past to give themselves whatever flexibility necessary to win the battle over inflation.

All in all, the pathway is there for the Fed to not have to raise rates further and create the soft landing for the economy which leans bullish in the long run.

8/23 PMI Flash: This report rarely makes headlines, but is a strong leading indicator of the trends found in the next round of ISM Manufacturing & Services reports the first week of the new month. Thus, always beneficial to review this announcement to appreciate if odds of recession are going higher or lower. Right now investors expect this reading to be the same as last month at 52 with services in better shape than manufacturing.

9/1 Government Employment Situation: The job add expectations continue to ebb lower as the Fed rate hikes slow down the economy. But gladly has not tipped over into negative territory that would raise the unemployment rate…and risk of recession. Right now, the forecast calls for 180,000 jobs added which would be a very “Goldilocks” outcome where the unemployment rate would stay low. On the other hand, not so many jobs created as to heat up wage inflation that would concern the Fed.

9/1 ISM Manufacturing: This has been the weakest part of the economic picture with 9 straight readings in contraction territory (below 50). Right now, it seems that June may be the worst of these readings with July a notch higher…and the August reading on 9/1 expected to be another step in the right direction.

9/6 ISM Services: This is the larger, and healthier part of the economy leading to the positive GDP readings. It is currently expected to be somewhat in line with last month’s 52.7 reading, which is modestly in expansion territory. Yet I think the impressive mid month reading for Retail Sales may lead to a topping of current ISM Service expectations.

9/13 Consumer Price Index (CPI): Inflation reports are the most telling of what the Fed will do with future rate hike decisions. Gladly this key inflation report has been moderating faster than expected for quite some time. Thus, that positive trend staying in place will be key to reignite bullish sentiment. And will have a fair amount to do with the next item…

9/20 Fed Rate Announcement: Right now, investors place 85% odds of the Fed pressing pause on rates. And yes, this appears to be the pattern going back the past few meetings (hike > pause). Plus the tenor of what was said at the last announcement combined with inflation reports since then came coming under expectations.

As always, what Powell says at the press conference has much more impact on the market than the initial rate decision. What investors will be looking for is whether the dovish tilt that started in July will be more or less dovish this time around. Obviously…the more dovish it sounds for the future…the better it is for stock prices.

Trading Plan

Fundamentally we are in a bull market. And technically in a bull market because we are well above the 200 day moving average. But yes, stocks were overdue for a stiff sell off which is taking place now.

Now we are just trying to find bottom. Maybe already found it…but sense a test of the 100 day moving average at 4,305 could unfold.

But even at current prices we are in a “buy the dip” scenario as the market will likely retest 4,600 early in the Fall. Then have a good shot for Santa Claus rally to help close out the year taking a shot at the all time high of 4,818.

Now we just need to consider what are the best stocks & ETF’s for this environment. And that is what the next section will tackle…

What To Do Next?

Discover my current portfolio of 6 stocks packed to the brim with the outperforming benefits found in our POWR Ratings model.

Plus I have added 5 ETFs that are all in sectors well positioned to outpace the market in the weeks and months ahead.

This is all based on my 43 years of investing experience seeing bull markets…bear markets…and everything between.

If you are curious to learn more, and want to see these 11 hand selected trades, then please click the link below to get started now.

Steve Reitmeister’s Trading Plan & Top Picks >

Wishing you a world of investment success!


SPY shares rose $0.35 (+0.08%) in after-hours trading Tuesday. Year-to-date, SPY has gained 15.43%, versus a % rise in the benchmark S&P 500 index during the same period.


About the Author

Steve is better known to the StockNews audience as “Reity”. Not only is he the CEO of the firm, but he also shares his 40 years of investment experience in the Reitmeister Total Return portfolio. Learn more about Reity’s background, along with links to his most recent articles and stock picks.
Buy the Dip NOW!

Please enjoy this updated version of weekly commentary from the Reitmeister Total Return newsletter. Steve Reitmeister is the CEO of StockNews.com and Editor of the Reitmeister Total Return.Click Here to learn more about Reitmeister Total Return


SPY – As the title of this article implies, Steve Reitmeister believes now is the time to buy the dip for the stock market. Simply 4,600 was too high for the S&P 500 (SPY) given current conditions. And the recent trip down towards 4,300 is too low. The key is knowing which stocks to buy to outperform. More about that in the article below…


Fret not dear investor. The recent rally for the S&P 500 (SPY) was overextended with this sell off being the natural consequence.

Let’s spend our time wisely discussing why stocks are down…how much lower they will go…why they will bounce…and when to buy back in for the next leg higher.

All that and more awaits you in today’s commentary.

Market Commentary

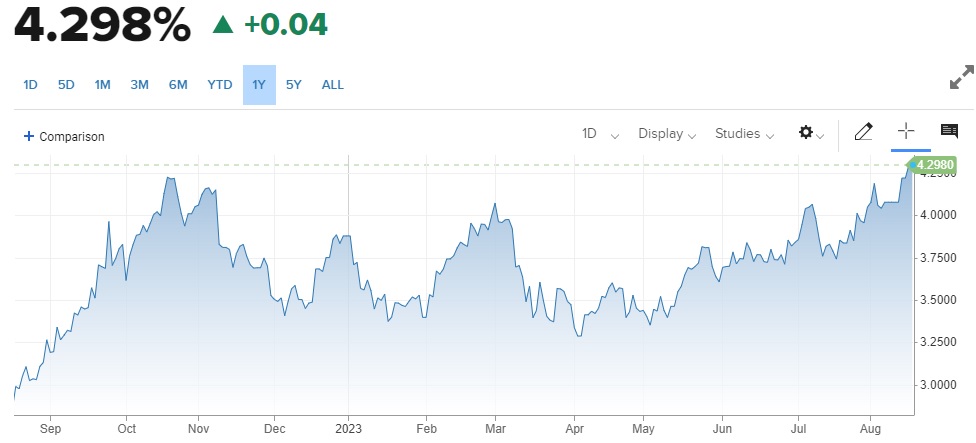
Good news is that the yield curve is getting less steep which decreases odds of a recession.

Bad news is that it is happening as long term rates are going up which is bad news for all forms of borrowing including cars, housing and long term investment in a business (which is the main fuel for economic growth).

Why is this happening?

It all started after the Fitch ratings downgrade for the US when the 10 year was closer to 3.8%…yet now is a good spot higher at 4.3%. Which is the highest level for these rates since the Fed embarked on their hawkish regime.

However, I suspect very little of it really has to do with the Fitch downgrade. The more I read on this topic…the more people are discussing the Fed minutes from Wednesday. That being where there is still solid concern on the part of committee members that inflation is well above target…not coming down fast enough…and that more rate hikes could be needed.

Even if they don’t raise rates again, which is my prediction, they could simply leave the current high rates in place longer than previous anticipated. This too would push up the longer end of the yield curve.

Why is this bad news for the stock market?

When you consider the importance of asset allocation between stocks and bonds…then the higher the bond rates, the more attractive bonds become…and the less attractive it is for stocks. So more investment dollars flow out of stocks towards bonds as rates escalate.

No doubt some of the recent sell off was simply investors finally taking some profits off the table. Unfortunately, there is more to the story given this investment trade off issue noted above as bond rates rise.

How much higher will Treasury rates go from here? I suspect not much higher UNLESS upcoming inflation readings are hotter than expected pushing the Fed to act more vigorously with additional rate hikes.

And yes, the more hawkish the Fed becomes…the greater the risk of recession…which clearly is a negative for stocks.

All in all, this sell off was long overdue. Yet, given the facts in hand it is hard to be bearish. In particular, how much inflation has come down without a recession forming, thus making soft landing the most likely possibility.

Further, beyond the soft landing the Fed will be lowering rates…meaning more accommodative. That has always been a good tasting tonic for stock gains.

Rather right now all we are determining the bottom of this move for which stocks bounce…and then play in a trading range for a while awaiting the next catalyst to bolt higher.

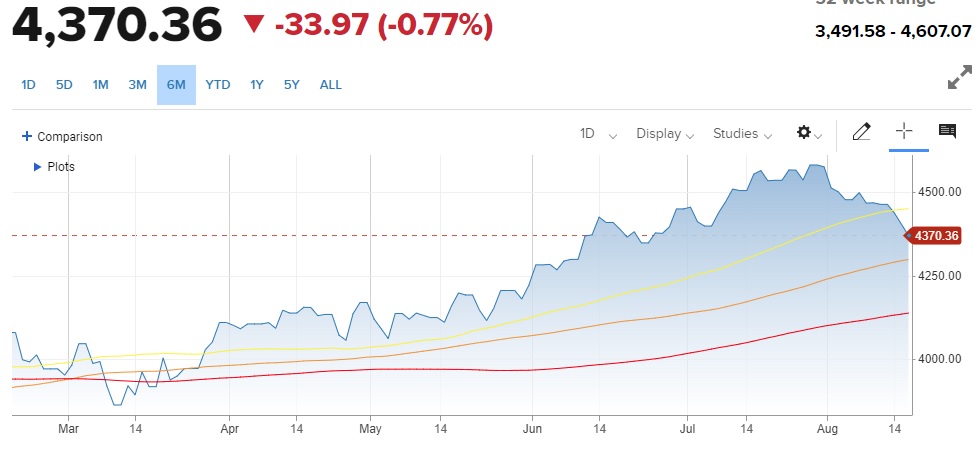
Thursday marked the 3rd straight close under the 50 day moving average (4,450). And the first close below 4,400 which was an area of psychological support. In fact, it spent most of the Thursday teetering at 4,400 before breaking lower in earnest.

As stated in my last commentary, I think there are solid odds that investors may push down to the 100 day moving average (4,292) before calling it quits on this overdue pullback. That is about 2% below Thursday’s close. Not too scary in the grand scheme of things given that we started the year around 3,800.

Trading Plan 

This is still a bull market til proven otherwise. But yes, investors are FINALLY reappreciating that the bearish argument was never gone. That the Fed could go to far creating recession.

So this pullback from 4,600 is creating a better resting place for stocks. As in a price that better balances the future bullish vs. bearish possibilities.

I continue to see this as a “buy the dip” especially for those who have been under allocated to the stock market this year. No doubt you have been waiting for an opportunity to get back in as you didn’t like chasing it when reaching 4,600. So now under 4,400 and likely finding bottom here soon…NOW IS YOUR TIME TO BUY IN.

I am practicing what I preach on this front as I put more money to work in my Reitmesiter Total Return portfolio. As well as putting 7 figures worth of cash back to work in my personal accounts this week.

If you are looking for the exact perfect moment…you will never catch it in real time. That fantasy of perfect timing leads to indecision…and then missing the train altogether.

Looking out to the end of 2024, when the market will be making new all time highs well above 5,000 (maybe even hit 6,000)…then it is crazy at this point to quibble over 1% here or there. Just jump in and act now!

What should you buy?

More on that below…

What To Do Next?

Discover my current portfolio of 6 stocks packed to the brim with the outperforming benefits found in our POWR Ratings model.

Plus I have added 5 ETFs that are all in sectors well positioned to outpace the market in the weeks and months ahead.

This is all based on my 43 years of investing experience seeing bull markets…bear markets…and everything between.

If you are curious to learn more, and want to see these 11 hand selected trades, then please click the link below to get started now.

Steve Reitmeister’s Trading Plan & Top Picks >

Wishing you a world of investment success!


SPY shares were trading at $435.87 per share on Friday afternoon, down $0.42 (-0.10%). Year-to-date, SPY has gained 14.83%, versus a % rise in the benchmark S&P 500 index during the same period.


About the Author

Steve is better known to the StockNews audience as “Reity”. Not only is he the CEO of the firm, but he also shares his 40 years of investment experience in the Reitmeister Total Return portfolio. Learn more about Reity’s background, along with links to his most recent articles and stock picks.
Home on the Trading Range

Please enjoy this updated version of weekly commentary from the Reitmeister Total Return newsletter. Steve Reitmeister is the CEO of StockNews.com and Editor of the Reitmeister Total Return.Click Here to learn more about Reitmeister Total Return


SPY – The nearly 20% bull run for the S&P 500 (SPY) from the March lows is over. Now it’s time to rest up in a trading range for the next run higher. Meaning this is the natural course of things. To relax after a hard run…and then store up the required energy for the next sprint. The best part is how we can use these more range bound periods to buy the dip on some stocks with terrific upside potential. Let’s talk about how we will do just that in this week’s Reitmeister Total Return commentary.


We FINALLY saw the stock market take a step back after a seeming non-stop 5 month rally. Many investment commentators point to the Fitch ratings downgraded of US debt as the primary cause. However, if we are being honest with ourselves….this self off was long overdue. The Fitch announcement was just a convenient excuse to hit the sell button for a while.

Friday was an interesting session worthy of note. The Government Employment Report seemed like a Goldilocks announcement. Not too hot…not too cold…just right helping the S&P 500 rise nearly 1% early in the session.

Yet as the day progressed those gains melted off the board leading to a -0.53% session. Even more interesting was the S&P 500 (SPY) closing below 4,500 and now probably on our way towards 4,400 (more on that in the Price Action section below.)

Even though we don’t like seeing red on the screen…this is healthy. That investors took the opportunity of an intraday rally to take more gains off the table.

On Monday we got a solid bounce back as investors have gotten into the habit of buying every dip the past several months as that strategy has paid off handsomely. What they didn’t know was a surprise announcement on Monday that Moody’s was downgrading their ratings on a slew of small to midsized banks. This reawakened the Risk Off sentiment from last week with more investors hitting the sell button in earnest on Tuesday.

This is the classic swinging of the fear/greed pendulum. The greed of the rally up to 4,600 was overextended. Simply conditions were not that pristine to keep rising. This left investors vulnerable to any bad news for which Fitch and Moody’s were reminders that the overall market may be ahead of itself.

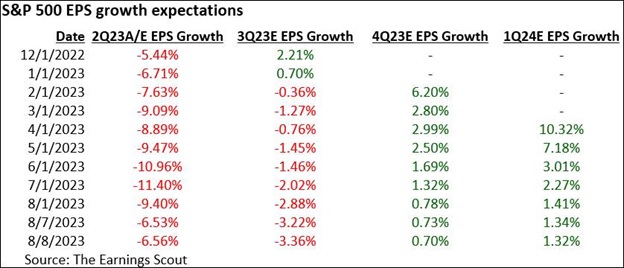
Another reminder of this is on the earnings front. As we come down the homestretch of Q2 earnings season we find that earnings estimates for the future have been trimmed for the next few quarters. Adding those 3 quarters together points to virtually no year over year growth.

The weak earnings outlook is NOT GOOD FUEL FOR A BULL RALLY

Especially true when the S&P 500 is already at a PE of 20. That is not necessarily overpriced…but it is rather fully priced. Thus, to reasonably expect more upside you need better earnings growth prospects for the future to compel higher prices without overly inflating PE.

This is a long way of saying that now is a logical time for the runaway rally to end and for us to enter a healthy consolidation period to digest recent gains. And thus be more selective about the stocks that should advance from here.

So Why Still Believe in a Long Term Bull Rally?

Because the Fed is providing more hints of a “dovish tilt”. That gained steam with the speech from Harken of the Philly Fed where he stated that likely no further rate hikes are needed. At this stage they just need to give the current high rates time to sink in and bring down inflation further. Then start thinking about lower rates.

Plain and simple, the future lowering of rates is a tail wind for the economy that increases the odds of better growth prospects (what is needed to push prices higher). Knowing that is on the horizon is a reason to be more bullish now.

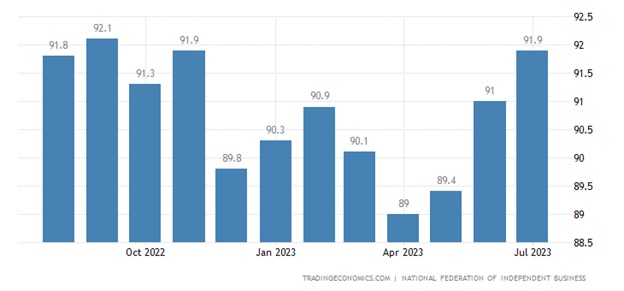
On top of that you have more business people feeling optimistic about the future. Here is the chart for the NFIB Small Business Optimism reading on Tuesday morning at 91.9.

As you can see this is the 3rd straight month of improvement and the highest reading in quite a while. This increased optimism is a precursor to improving growth trends.

Think about this. First you feel good about something…then you act on that positive impulse. This is why sentiment surveys are considered leading indicators of future economic activity.

Putting it altogether there is stronger reasons to believe that recession will be avoided during this rate hike cycle. If so, then the economy should pick up from here…which lifts earnings prospects…which is necessary fuel for share price appreciation.

Price Action & Trading Plan

Here is the updated S&P 500 chart:

Moving Averages: 50 Day (yellow), 100 Day (orange), 200 Day (red)

Right now 4,600 is setting up as a spot of stiff resistance and now trying to find support on the underside for likely a trading range to form. My guess is that the 50 day moving average around 4,420 is about as low as stocks need to go.

This sets up for a trading range where we likely swim around for a few months before the typical holiday rallies of November/December kick in giving us a real shot at the previous all time high of 4,818.

This sets us up nicely for a stock pickers market which is my favorite. Meaning where the overall market is kind of lukewarm…but those with a stock picking advantage find way to carve out profits.

In our case, the POWR Ratings is a big advantage in our corner to find stock picking profits in any market environment…especially an environment where the leaders are overripe and investors will rotate to more attractive, underpriced plays.

What To Do Next?

Discover my current portfolio of 5 stocks packed to the brim with the outperforming benefits found in our POWR Ratings model.

Plus I have added 4 ETFs that are all in sectors well positioned to outpace the market in the weeks and months ahead.

This is all based on my 43 years of investing experience seeing bull markets…bear markets…and everything between.

If you are curious to learn more, and want to see these 9 hand selected trades, then please click the link below to get started now.

Steve Reitmeister’s Trading Plan & Top Picks >

Wishing you a world of investment success!


SPY shares fell $0.10 (-0.02%) in after-hours trading Tuesday. Year-to-date, SPY has gained 18.23%, versus a % rise in the benchmark S&P 500 index during the same period.


About the Author

Steve is better known to the StockNews audience as “Reity”. Not only is he the CEO of the firm, but he also shares his 40 years of investment experience in the Reitmeister Total Return portfolio. Learn more about Reity’s background, along with links to his most recent articles and stock picks.