This week we have a stock market forecast for the week of 6/27/21 from our friend Bo Yoder of the Market Forecasting Academy. Be sure to leave a comment and let us know what you think!
The S&P 500 (SPY)
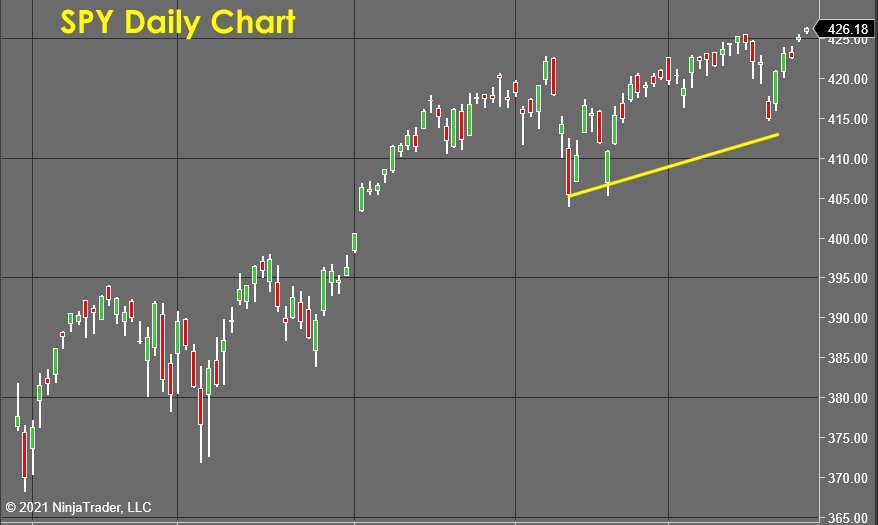
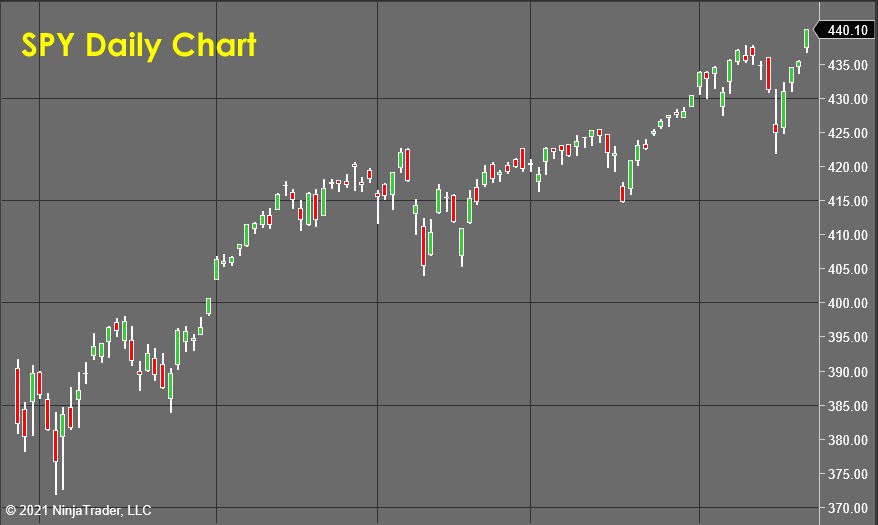
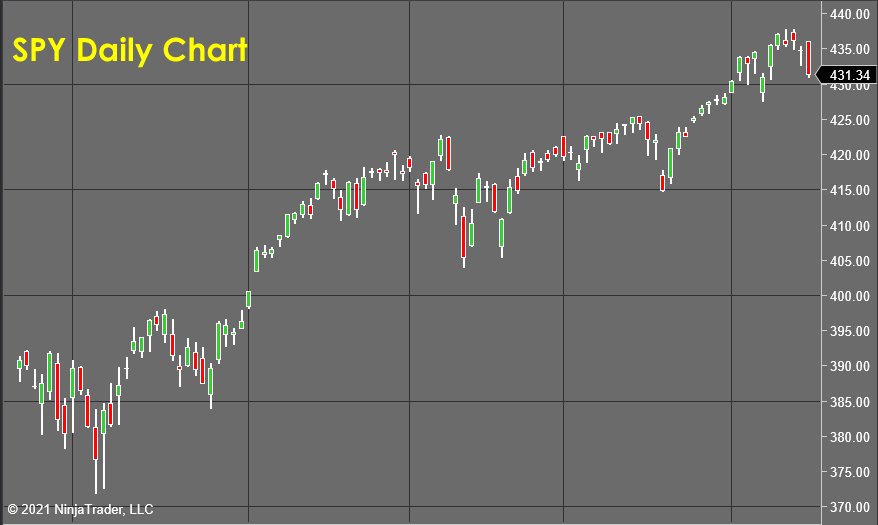
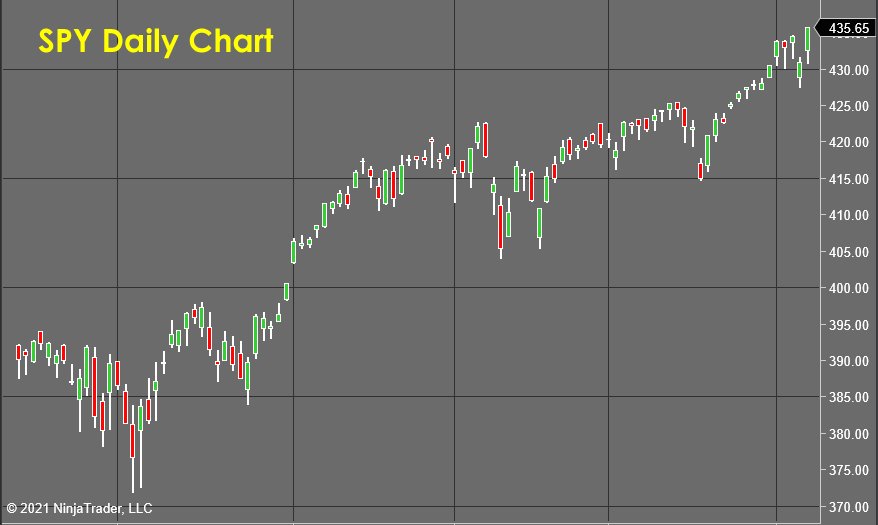
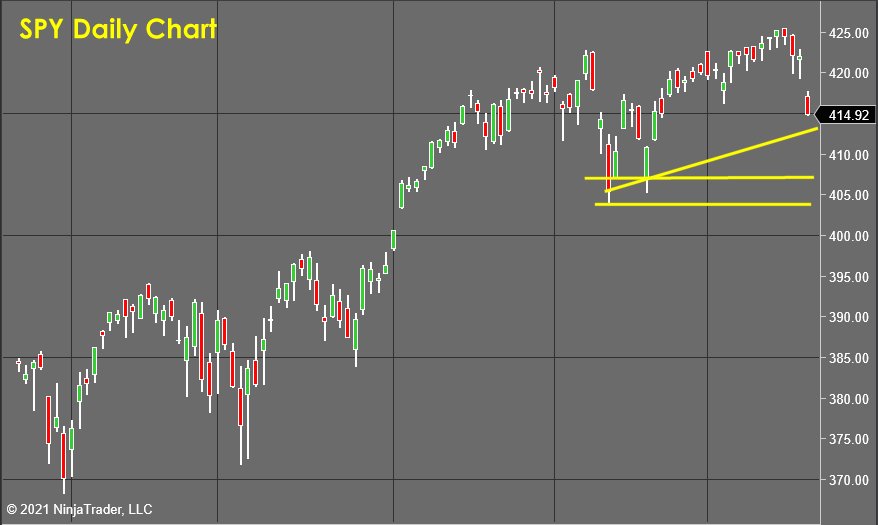
It's been a fairly volatile week for the S&P 500, as price trampolined up off the $415 per share level to close out the week in the “all-time highs” zone.
One thing most people don't understand about the markets is that the majority of money made by institutions is fee-based rather than focused on capital gains... This means that most big players in the markets aren't as interested in whether or not the market or a stock goes up or down, but instead how much volume of order execution is seen in any given area.
All-time highs are an incredible focal point for anybody following a market.
There's always a ton of liquidity at the highs... Stop losses from the short constituencies, buy orders from the breakout traders, and orders to add risk from the momentum trading community.
The supply/demand forces that I'm seeing as new highs are experienced are consistent with my observations/forecast from previous weeks.
Yes, prices are going higher, but not in a heavily sponsored manner. This indicates that the breakout is likely to be low momentum or “a false breakout.”
While the odds are not strong enough right now to take a position in the S&P on the short side, I think it will be advantageous to add some short exposure this week in an attempt to capitalize on what is likely to be a more bearishly inclined week.
If the breakout is suppressed, that will produce a lot of knee-jerk selling as those who bought the breakout scream “not again” and scramble to exit their trades. That’s the wave I hope to "surf” in the coming weeks.
Simon Property Group (SPG)
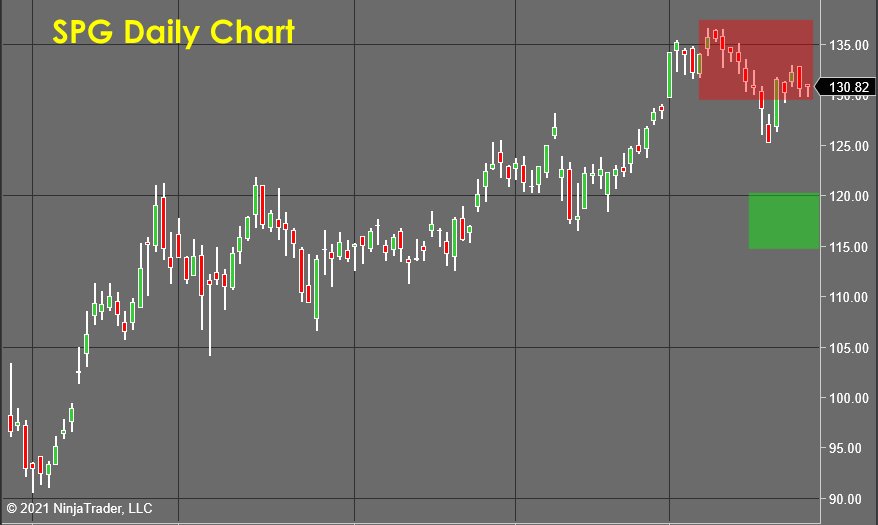
Simon Property Group has been in a sustained uptrend for many months. You could have bought any one of the pullbacks that have been experienced and produced a profit. This creates a habit of “buying the dip,” except that the last pullback showed unusual bearish sponsorship.
As this stock bounced away from the support offered by the $125 per share level, there has been little bullish aggression, and a lower high is now forming near $131 per share.
This will likely produce one of two outcomes...
The stock will retest the lows near $125, and that support will hold again, confirming that the weakness was little more than a cycle within a complex correction.
Or...
As the stock tests the lows near $125 per share, the bearish aggression will increase, and a breakdown will occur to take the price down towards the $120 per share area.
The odds for a bounce near $125 per share are pretty low, so I'm interested in considering short exposure here within the red zone. Unless this trade has to be scratched for a small profit, I would expect to see price decline back down towards the Green Zone, where profits can be taken.
Fluor Corporation (FLR)
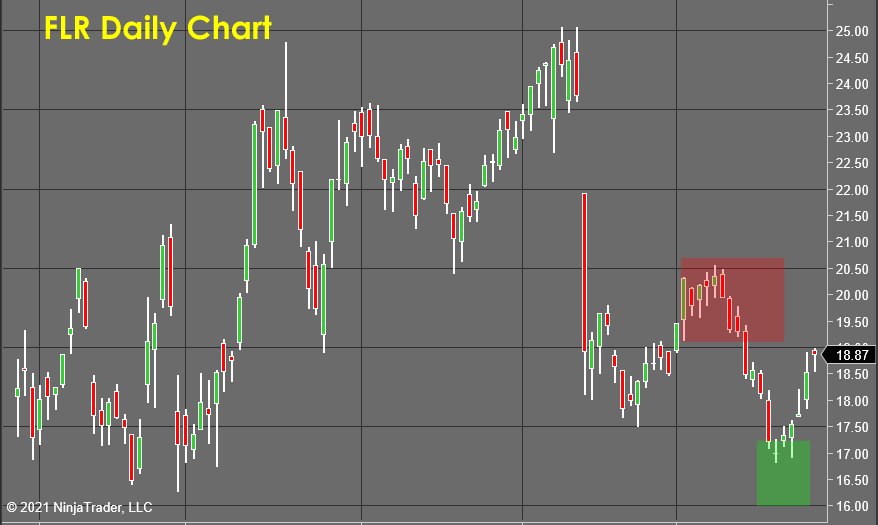
The profits taken in Fluor Corporation (FLR) offer a teachable moment for any readers who haven't fully digested the power that active trading offers. This was a classic cycle trade… short into an area of resistance, taking profits in an area of support. Not expecting a trend, not holding any wiggles, a simple in and out scenario.
This kind of “grind trade” isn't sexy or anything you can brag about, but these are the sorts of trades that make up the backbone of any professional trader's profit and loss statement.
There is also a beauty which I greatly enjoy in the craft of capturing the majority of the move the market made available, then moving on and being able to look back at the elegance and precision of the entry and exit points with 20/20 hindsight.
Honestly, the artist in me enjoys a trade like this FAR MORE than a trade that pays out a lot more in terms of monetary gains like the profits recently taken out of the gold market.
I used a version of this exact strategy to win the 2019 U.S. Investing Championship and have been teaching it to my students for a decade.
Learn The Strategy
In trading, confidence and consistency are everything because of the compound nature of trading profits. It's always frustrating to me when I hear someone new to trading talking with excitement about how somebody took fast, quick, and easy profits. Yes, a windfall is always a nice thing, but the real wealth is built in compounding your account with consistency long term.
Albert Einstein once said that compounding interest is the most powerful force in the world, and we have proved that a number of times as clients in our practice turned a $500 practice account into more than $10,000...
An enviable feat that would have been impossible if they hadn't been reinvesting their profits and growing their accounts exponentially through compounding.
So, with that understanding, you can see how critical it is to find a trading style that you enjoy and execute consistently over a long time.
Instead, most traders are very short-sighted and chase after short-term profits, which in the paradoxical world of trading pretty much guarantees they'll never get what they want.
So stop chasing after the money and instead chase after rock-solid consistency, accuracy, confidence, and a trading style that won't burn you out. You'll have a long and wonderfully successful career!
Gold (GLD)
I received a comment on gold last week that brings up a point that might be useful to clarify. The comment I received dealt with the next message from the Fed, discussion of government policy, and other market impactful events (And he was very likely to spot on in his analysis).
However, you'll almost never see me talking about fundamentals in my forecast. They are traditionally considered because I don't believe they are nearly as impactful as the ultimate ROOT fundamental in the markets... supply and demand forces.
In addition, I have over 20 years of experience trading the markets actively, and from all of those iterations, a very clear pattern emerges... When you have an accurate and consistent analysis or forecasting methodology, its indications will align closely with the geopolitical, fundamental, and other market forces at critical turning points in price.
This saves a lot of time and effort doing your forecast analysis because you no longer must go deep into the geopolitical relationships, personalities, and vision of a company's leadership, handicapping FDA approval of a new medical therapy, etc. All these things are very imprecise and subjective, which reduces consistency and accuracy over time.
In these forecasts, I am ONLY measuring supply and demand pressures, coming from the 8 major market forces that drive prices... and then comparing them against measurements that were made over a consistent period of time in the past.
As mentioned before, this is the same concept used to forecast the path of a hurricane. You use radar or a chase plane to precisely locate the hurricane, then measure how far it is gone over a specific period of time. From this “track” of observations, you can then make precise forecasts about what is likely to happen next period.
Like forecasting a hurricane, no forecasting methodology or technology is perfect. Hence, there is a margin for error, but with good observation and data, the forecast accuracy rate is consistent and significant.
That being said, sometimes there just isn't enough quality in the data to make a confident forecast.
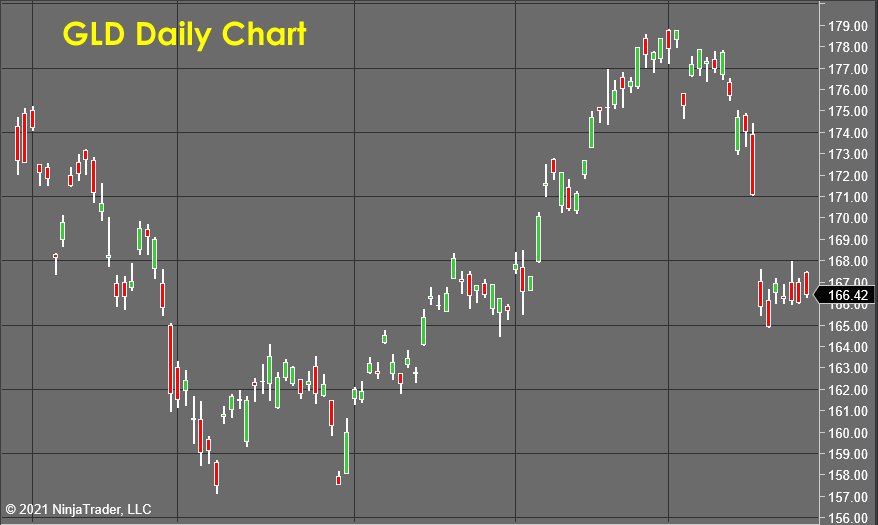
That's where we are in the gold market right now. Gold has gone through the forecasted correction as expected and is experiencing some stable support here near $165 per share.
This is good for the bullish argument, as each day that passes within this support zone erodes the bearish energy that much more. I suspect we will see one more push to the downside, and as that fails, there will be an opportunity to put on some more long exposure in this market.
I'm firmly convinced that we will retest the highs and break beyond at some point, so I will continue to monitor this market closely!
International Paper (IP)
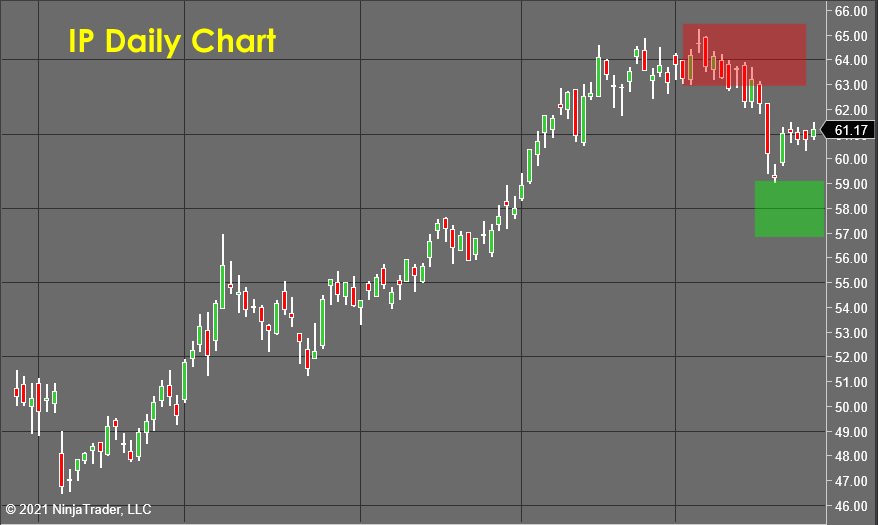
I guess I was a little TOO PRECISE with my forecast of the green zone for International Paper (IP)...
The stock went right down out of the red zone to just “kiss” the green zone last Friday. For those who didn’t take profits that day, I suggested an exit that would have been executed just a bit under $60 into Monday’s gap up for another easy and successful cycle trade.
To Learn How To Accurately and Consistently Forecast Market Prices Just Like Me, Using Market Vulnerability Analysis™, visit Market Forecasting Academy for the Free 5 Day Market Forecasting Primer.
Check back to see my next post!
Bo Yoder
Market Forecasting Academy
About Bo Yoder:
Beginning his full-time trading career in 1997, Bo is a professional trader, partner at Market Forecasting Academy, developer of The Myalolipsis Technique, two-time author, and consultant to the financial industry on matters of market analysis and edge optimization.
Bo has been a featured speaker internationally for decades and has developed a reputation for trading live in front of an audience as a real-time example of what it is like to trade for a living.
In addition to his two books for McGraw-Hill, Mastering Futures Trading and Optimize Your Trading Edge (translated into German and Japanese), Bo has written articles published in top publications such as TheStreet.com, Technical Analysis of Stocks & Commodities, Trader’s, Active Trader Magazine and Forbes to name a few.
Bo currently spends his time with his wife and son in the great state of Maine, where he trades, researches behavioral economics & neuropsychology, and is an enthusiastic sailboat racer.
He has an MBA from The Boston University School of Management.
Disclosure: This article is the opinion of the contributor themselves. The above is a matter of opinion provided for general information purposes only and is not intended as investment advice. This contributor is not receiving compensation for their opinion.
