Our May Stock Market Prediction - Part 2

If you missed PART 1 (SP500 Price Forecast) be sure to read it here.

Here is PART II let’s take a look at the NQ Weekly chart with the ADL predictive price modeling.

We are going to include predictions made by our Adaptive Dynamic Learning (ADL) price modeling system that originated from December 2017 going all the way forward through to the end of May 2019.

At this point, we are going to highlight our earlier predictions (all of 2018 and into Q1/Q2 of 2019) and show you what the market has done since these calls were made back in September 2018. Pay attention to this weekly chart and pay attention to the YELLOW ARROWS on this chart. We have highlighted key predictive price modeling points with these yellow arrows on the chart to show you what our ADL predictive modeling system suggested would happen back in December 2017.

Now, take a look at the NQ Weekly chart with the ADL predictive price modeling results displayed onto it. Pay attention to the similarities in the price patterns and the rotational modeling differences between the two charts. The ES ADL modeling predictions from “Part I” are similar to this NQ chart, but the differences really tell us about how the technology-heavy NASDAQ (NQ) will react in a different manner than the Blue-Chip heavy ES. Continue reading "Our May Stock Market Prediction - Part 2"

Our May Stock Market Prediction - Part 1

As we enter the final stage of our stock market prediction from nearly 5 months ago, we thought it would be a good time to revisit these predictions and to update all of our followers with some timely and, apparently, accurate market data. We hope that many of you remember out predictions from September 2018 where we called for a 5~8% market decline, followed by a basing market headed into the November 2018 US elections, followed by a deep “Ultimate Low” price rotation before we called for an incredible upside price rally? The reason it is so important to watch for and understand all of our research is that we are attempting to provide great value and insight to our followers as well as help them protect their open positions from unknown risks.

As a bonus to all of this, we are going to include predictions made by our Adaptive Dynamic Learning (ADL) price modeling system that originated from December 2017 going all the way forward through to the end of May 2019. Can you imagine what it would be like to have a tool that could show you what is likely to happen going forward 6 months, 12 months or even 24 months into the future? Well, that is what we have with the ADL predictive price modeling system and we are going to show you how well it has been able to pick the future of the markets for the past 15+ months. Here we go.

At this point, we are going to highlight our earlier predictions (all of 2018 and into Q1/Q2 of 2019) and show you what the market has done since these calls were made back in September 2018. Pay attention to this Weekly ES (S&P 500 chart) and pay attention to the YELLOW ARROWS on this chart. We have highlighted key predictive price modeling points with these yellow arrows on the chart to show you what our ADL predictive modeling system suggested would happen back in December 2017. Continue reading "Our May Stock Market Prediction - Part 1"

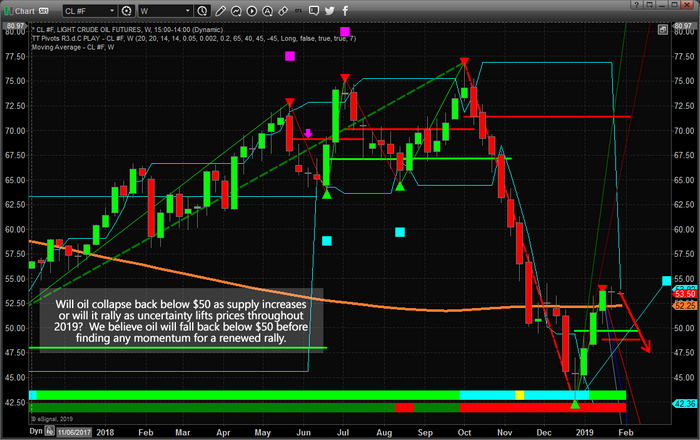
Will Oil Find Support Above $50?

Recent global news regarding Venezuela, China, and global oil supply/production have resulted in the price of Oil pausing over the past few weeks near $53 to $55 ppb. We believe the continued supply glut and uncertainty will result in oil prices falling, briefly, back below $50 ppb before any new price rally begins. Our researchers at The Technical Traders believe historical resistance near $54~55 is strong enough to drive prices lower before new momentum picks up for a renewed price rally.

Oil

Eventually, yes, oil will rally above $55 and attempt to target the $65+ price level. Yet we don’t believe that move is going to happen right now. We believe the global uncertainty; the slowing Chinese economy and the global supply glut will result in a fundamental price decrease before any momentum for an upside price move begins. Our analysis suggests a price move back below $50 ppb, likely targeting the $46~47 level, where basing may occur. Continue reading "Will Oil Find Support Above $50?"

What's Next For Gold?

Early trading on January 4, 2019, saw Gold reach just above $1300 per ounce – confirming our price target from our research and posts on November 24, 2018. The importance of this move cannot be under-estimated. Traders and investors need to understand the recent rally in the metals markets are attempting to alert us that FEAR is starting to re-enter the market and that 2019 could start the year off with some extended volatility.

Our research has shown that Gold will likely rotate between $1270~1315 over the next 30~60 days before attempting to begin another rally. Our next upside price target is near $1500. We will continue to post articles to help everyone understand when and how this move will happen. We expect Gold to rotate near the $1300 level for at least another 30 days before attempting another price rally.

Pay attention to the Support Zone on this Daily Gold chart and understand that price rotation is very healthy for the metals markets at this point. A reprieve in this recent Gold rally would allow the start of 2019 to prompt a moderate rally in the US stock market as well as allow a continued capital shift to take place. As capital re-enters the global equities markets, investors will be seeking the best investment opportunities and safest environments for their capital. Our belief is that the US stock market will become the top-tier solution for many of these investments. Continue reading "What's Next For Gold?"

Metals Moving In Unison For A Massive Price Advance: Part 1

Are the metals markets ending a price correction in unison and preparing for a massive price advance? This is the question we asked our research team to investigate and their findings may help skilled traders identify great opportunities in the future. This multi-part research article will share our most recent opinion about the metals markets as well as share some critical new data that can shed some light into what we believe will become a massive upside price rally in the metals markets. Let’s get into the data.

When one considers the global demand for Gold as a hedge against economic crisis events and the continued advancement in gold reserves for China and Russia, one has to consider the supply side issues that are a result of central banks global demand. Even though global production of Gold is near an all-time high, the demand from foreign nations and central banks are also near all-time highs. This correlation creates a demand-side consumption that offsets supply and, in some ways limits, consumer, retail and technology suppliers.

Our researchers focused on this aspect of the supply/demand equation when trying to analyze recent metals price action in correlation to disruptions that could occur in the markets. For example, increased central bank buying/hoarding of gold could dramatically result in prices spiking. Foreign market disruptions in supply could also send prices spiking. Global conflicts and or continued trade issues could send metals prices skyrocketing. Anything to do with the supply side for Gold could send prices higher. At least this is the conclusion of our research team at this time. Continue reading "Metals Moving In Unison For A Massive Price Advance: Part 1"