

Today I would like to introduce Karen of Wealth Wizard World. Karen is an experienced trader who took an interest in the markets at a very young age has continued since then. Through her own blog and website, Karen shares what she has learned in her twenty-plus years and today she has agreed to share this knowledge with Trader's Blog readers as well.
===================================================================
I’ve traded for many years - about 20 to be precise. During the early years, I read everything I could get my hands on and tried several methods. The lessons learned were not what to do, but what not to do, and yet I was looking for something more.
There are lots of indicators to use and chart patterns to watch. What bothered me was that I realized that indicators lag. They respond to the movement of price.
Chart patterns work very well for some people, but they didn’t do much for me. I saw several head and shoulders patterns break to new highs; flags, pennants, and wedges break opposite of what they were supposed to do. What was an eager, studious, young trader supposed to do?
Finally it dawned on me – price! Price is the king of the chart. I started paying closer attention to price action. My reading focused on those experts that relied most on interpreting price movement. What I learned is the foundation of all my trading. It’s not a 100% foolproof method, but it helps keep me in winning trades and letting go of losers.
I’m going to show you the basics of how I find support and resistance on a chart. This method will show you, in advance, where prices are apt to stall or where they may rebound. I will also demonstrate how to use a couple of indicators in conjunction with support and resistance that will boost your confidence in your trading decisions.
This is really a very mechanical system and that’s why I like it. There is no emotion, just reaction. There is no guesswork, but verifiable, actual numbers. It works on any time-frame and in any market that is traded --with stocks, ETF’s and indexes. You can see, in advance, where you need to be prepared to take action.
Trading is like war. You’re battling some very smart and very well-capitalized opponents. To be successful you need an edge. What I’m about to share will help you gain an edge and hopefully, put more money in the bank.
Identifying Support and Resistance
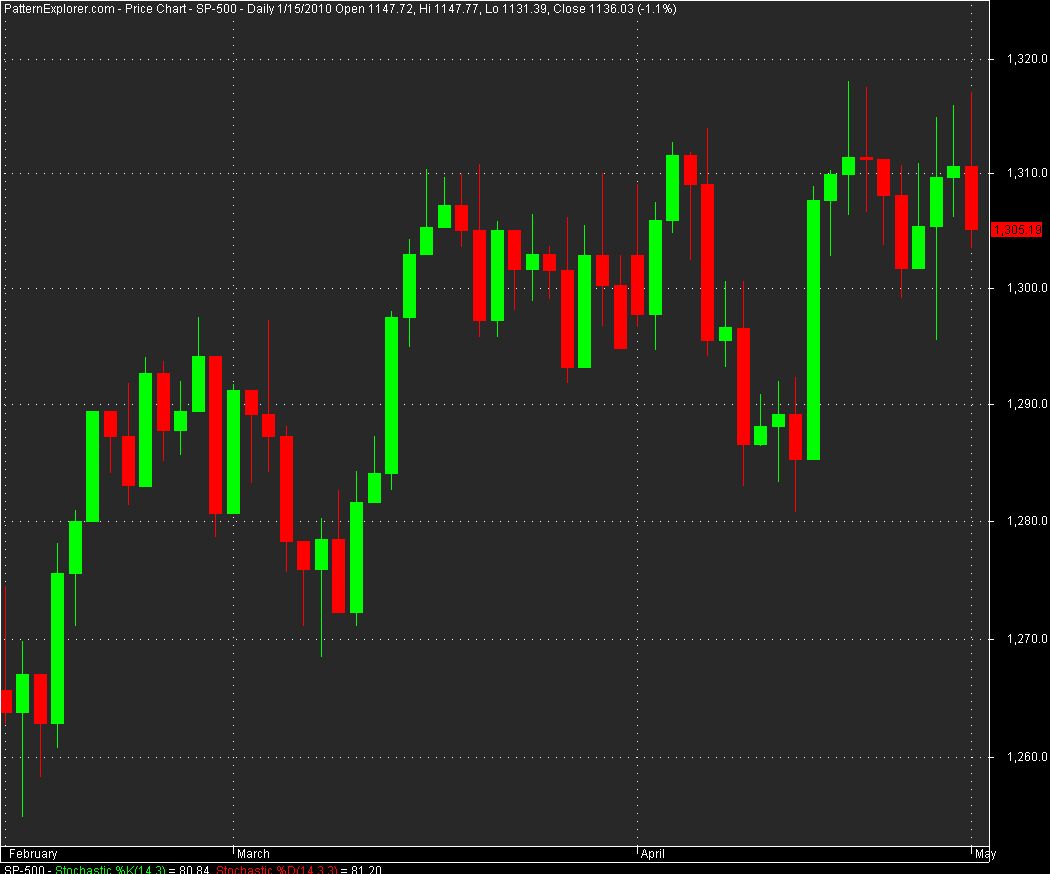
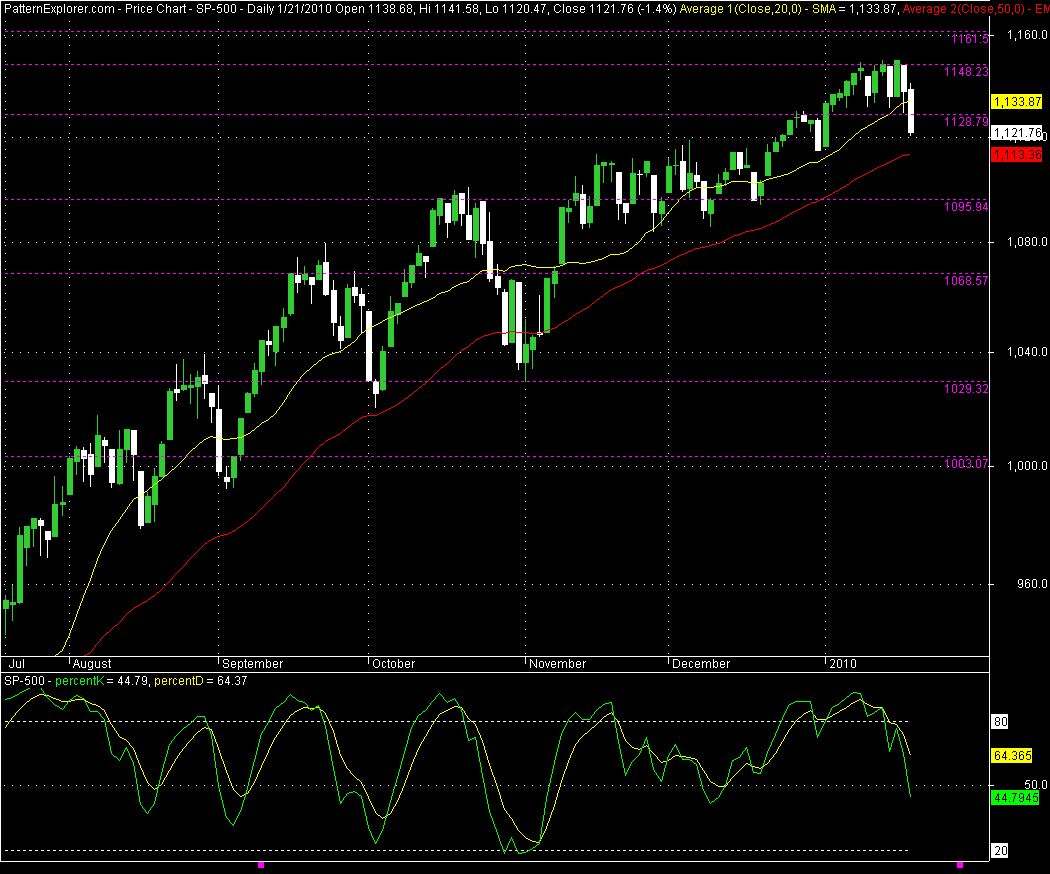
Resistance is an area where price was rejected and then declined or consolidated. Support is an area from which price rebounded or consolidated. Prices tend to cluster around areas of prior support and resistance. It’s as if price has a memory. Here’s an example of the S&P 500. What would it mean to you if you knew in advance, where price might hit resistance or find support?
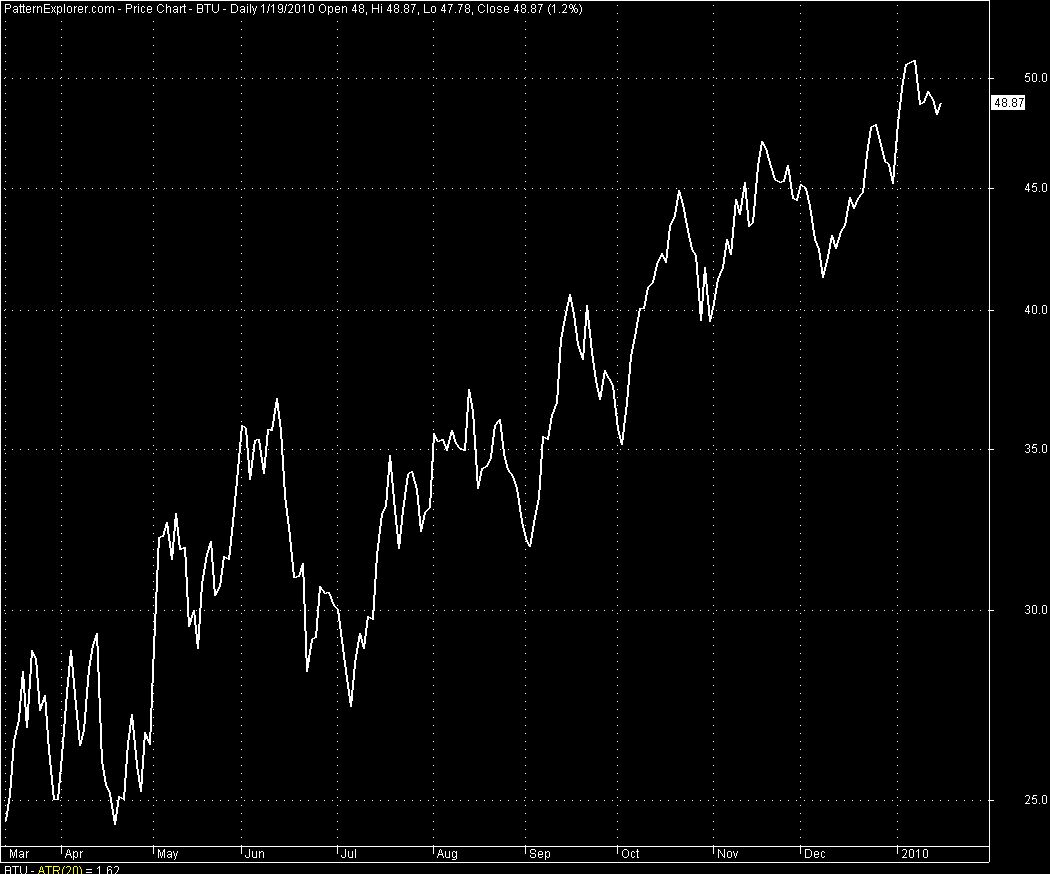
I suggest you use a candle chart. Ignore the wicks, but pay close attention to the solid candle body. Go back a couple of years and look for a smooth trending stock, because if it trended once, it will again. Following is a line chart showing a smooth trending stock.
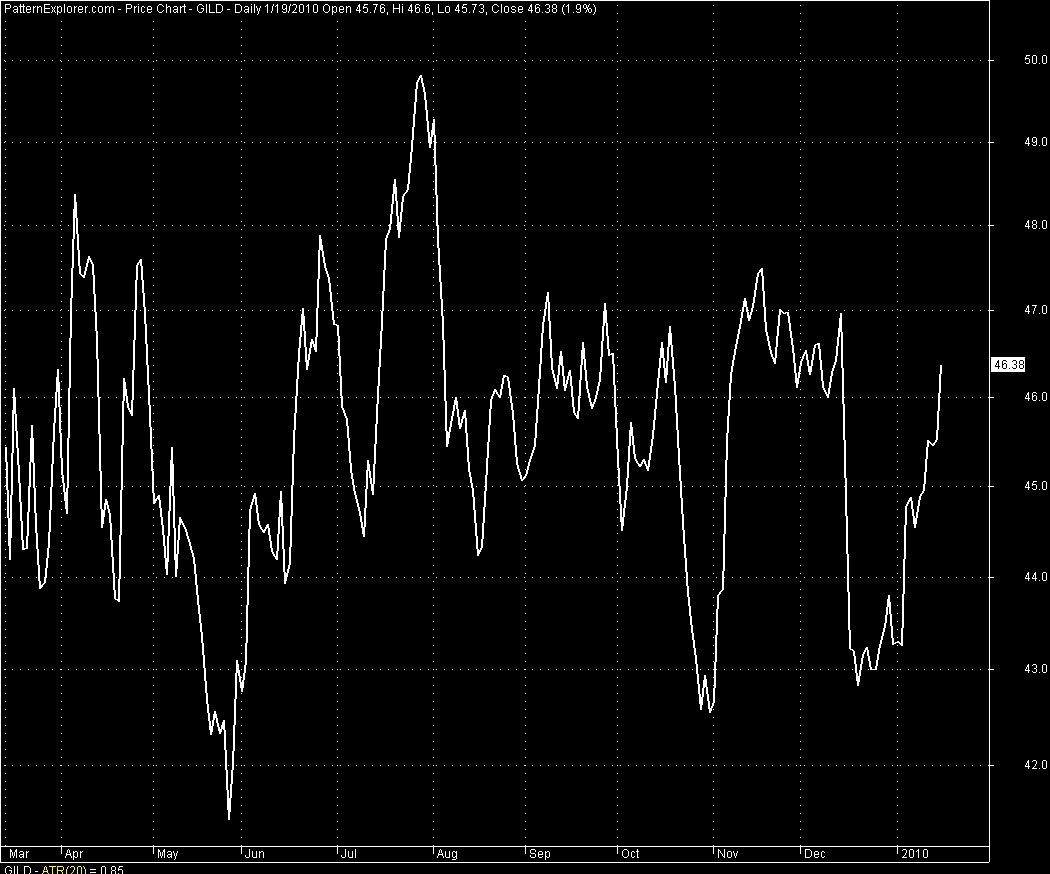
I avoid stocks like this one. It is all over the chart, with no particular direction:
Drawing Support and Resistance Lines
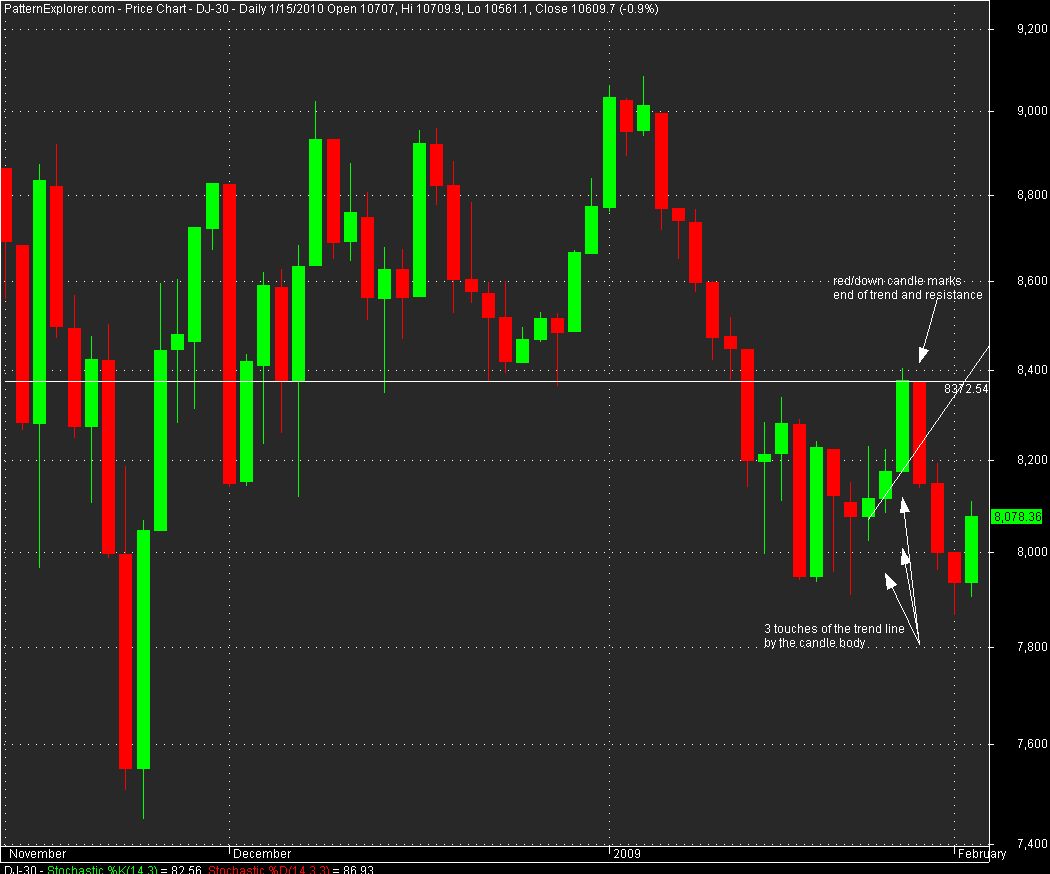
Here is the method I learned to draw support and resistance lines. Find a stock or ETF you’re interested in and find the last swing low. The first candle that starts to reverse your low is the starting point for a trend line. Draw the trend line up from the swing low and make sure it touches the candle bodies, but not the wicks. Watch for a red or down candle that reverses the trend. The top of that candle is your resistance line. Draw a line across the top of that red candle body.
Make sure your software lets you draw a support line that extends through all prices moving forward. Those lines are not only support and resistance today, but will be so in the future and we want to be able to see them.
Here’s an example of how to draw a resistance line:
To draw support lines just do the opposite - find the first candle that begins the swing down and draw the line straight down making sure you have 3 candle body touches. The first green candle that pierces the down sloping trend line is your support candle – draw a horizontal line beneath that candle.
This is the same chart of the Dow Jones Industrial. The white horizontal line is at the top of the red candle and is the resistance line you just drew.
Once the swing hit resistance it made a big red candle and started a swing down. Your support line is drawn beneath the first up or green candle that breaks the trend line. The swing high and resistance I’ve left in white the swing low and support I’ve marked in blue.
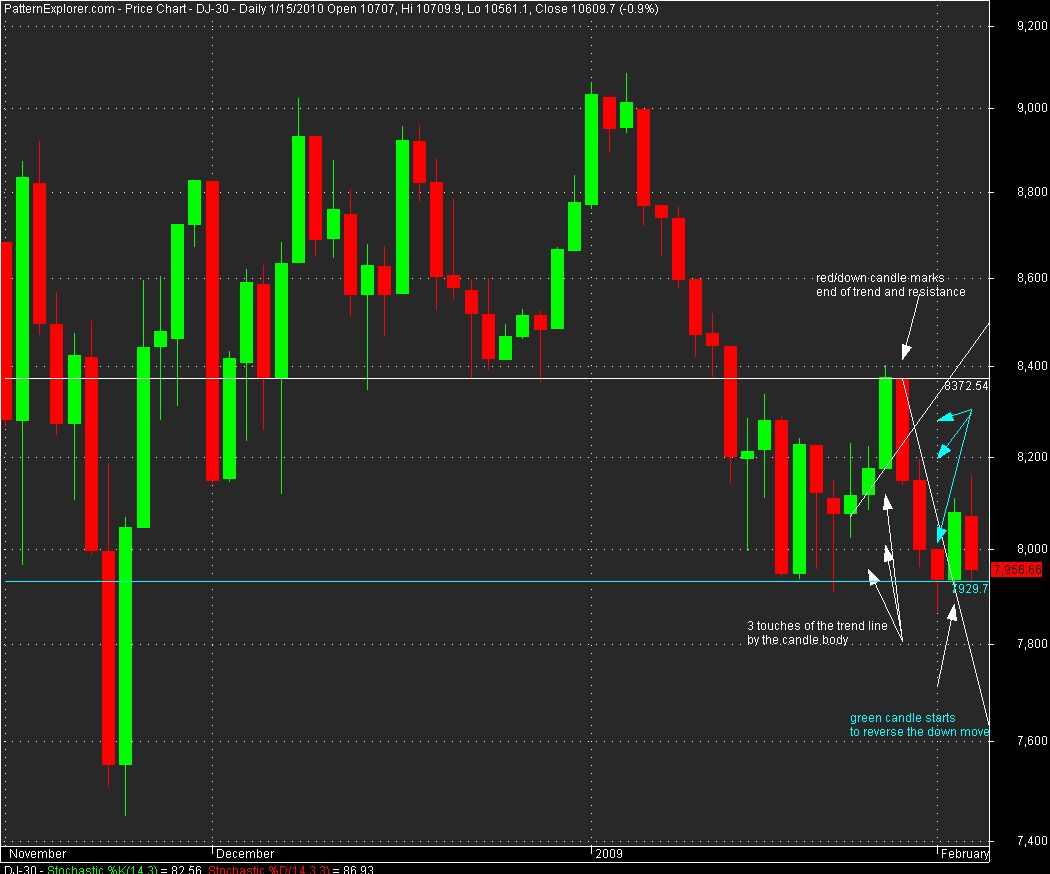
That’s all there is to it! Just keep drawing trend lines and marking support/resistance every time a swing breaks your prior support or resistance. Just make sure you have 3 valid touches of a candle body to draw a valid trend line.
Now I’ll show you the real value of this simple method.
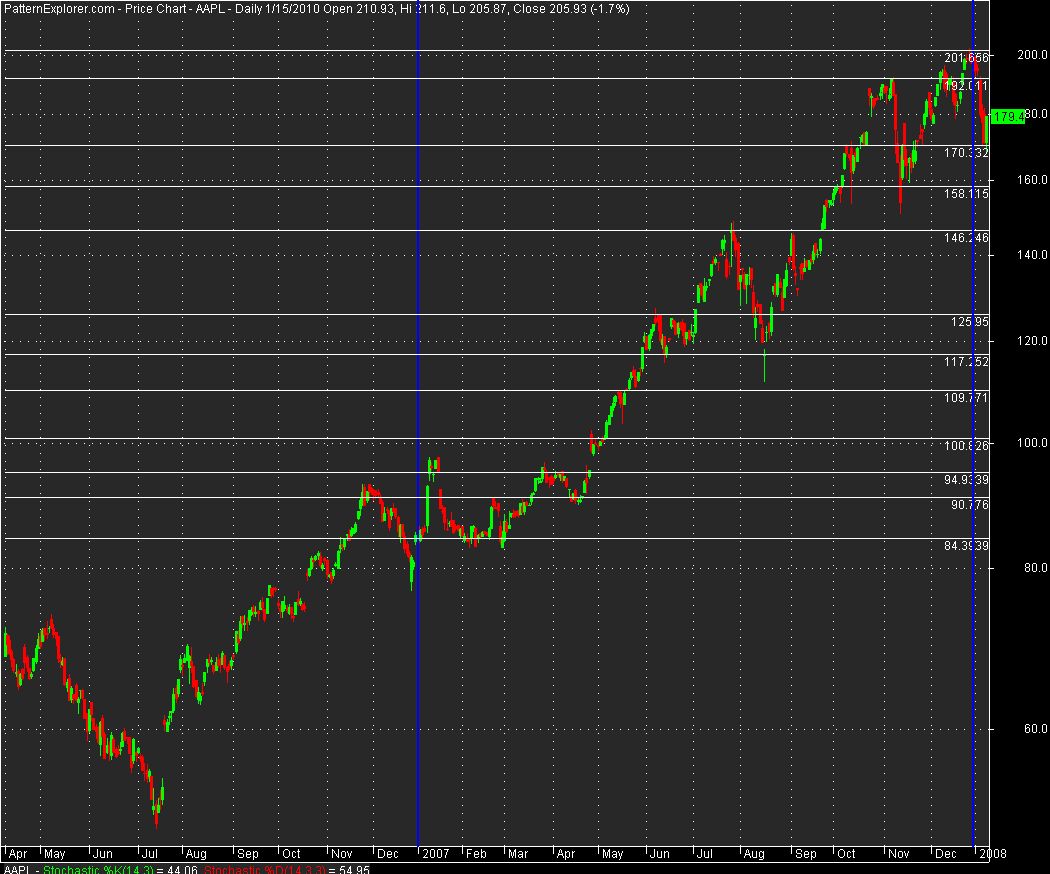
This is AAPL, one of my favorite stocks to trade. I drew the support/resistance lines starting at the first horizontal white line, January 2007, and I stopped drawing new support/resistance lines, December 2007. Notice how well price was contained within support and resistance for that year. But wait . . . .
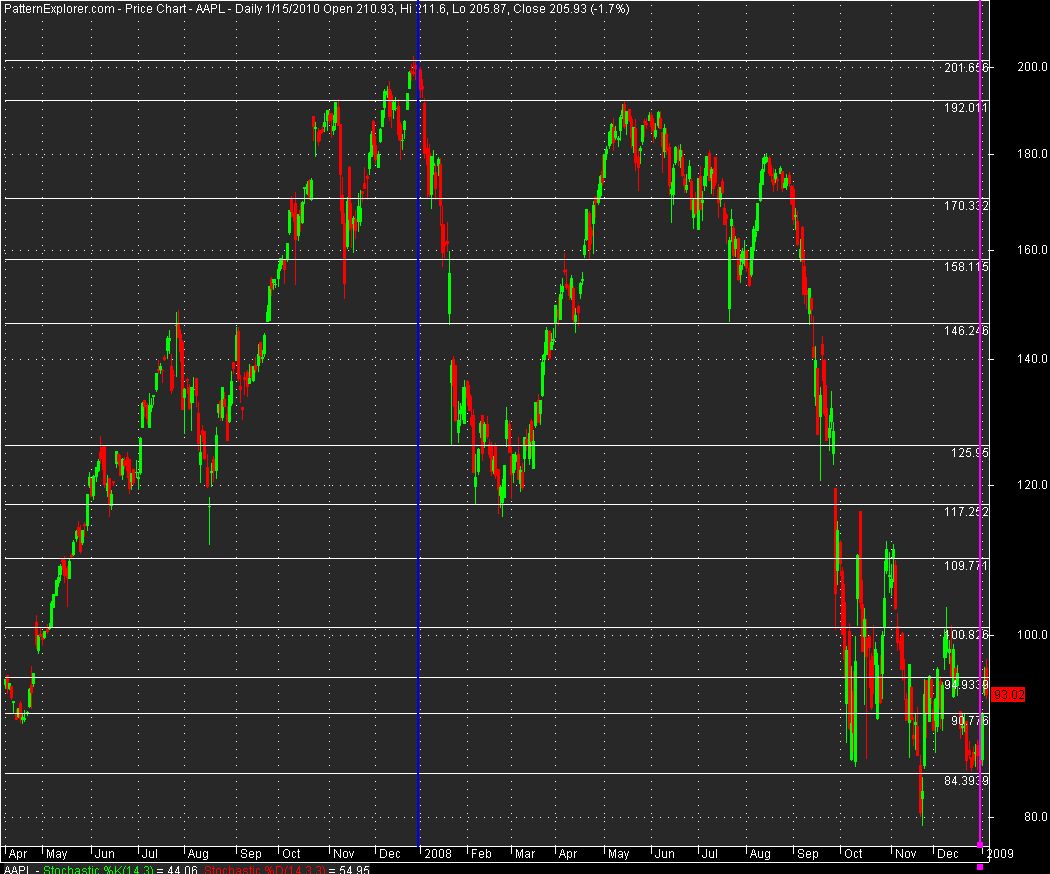
Look how well these same lines defined price movement in 2008 . . .
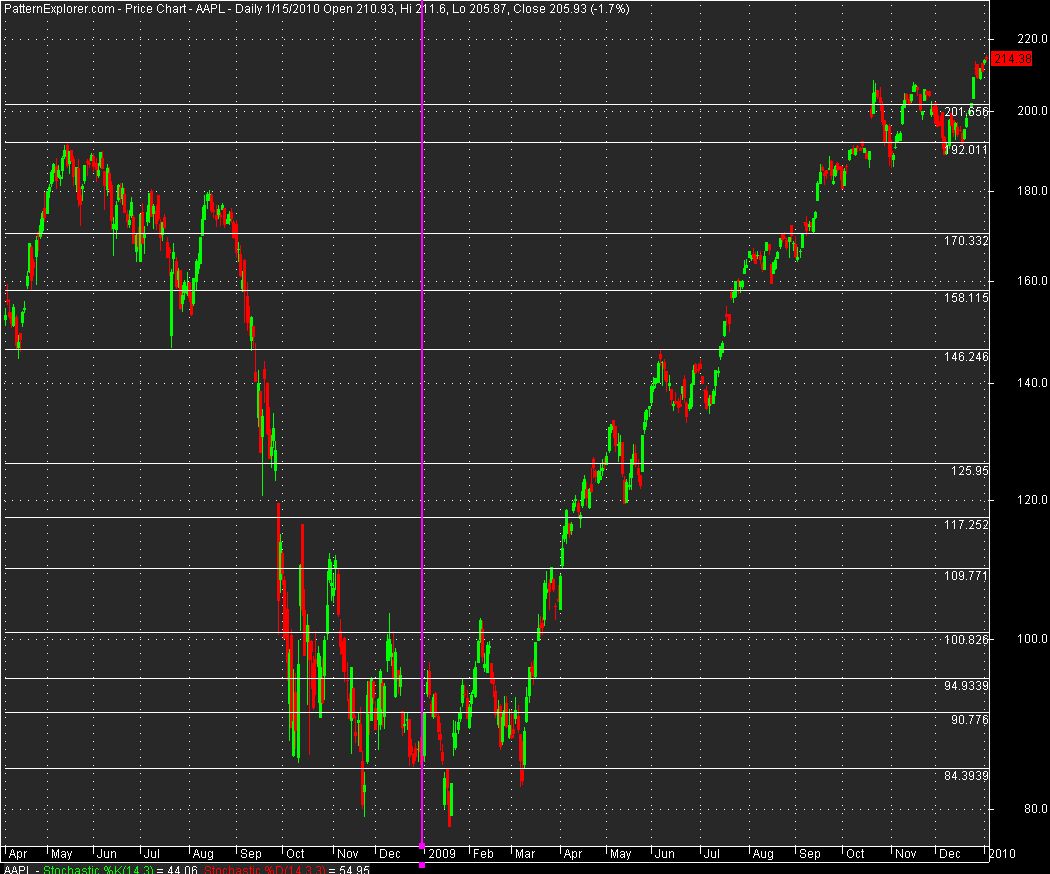
And again in 2009!
I recommend that you go back at least 2 years and start drawing support and resistance lines on a daily chart. You’ll also encounter swings between your support and resistance lines. If the distance between support and resistance is greater than 10 points and I can draw a valid support/resistance line between the larger range, I’ll do it.
Try this on your own charts and see how it works. It takes a little practice, but it works because I can plan my entries and exits in advance with no guesswork. Now I’ll show you a couple of trading strategies I use with support and resistance lines.
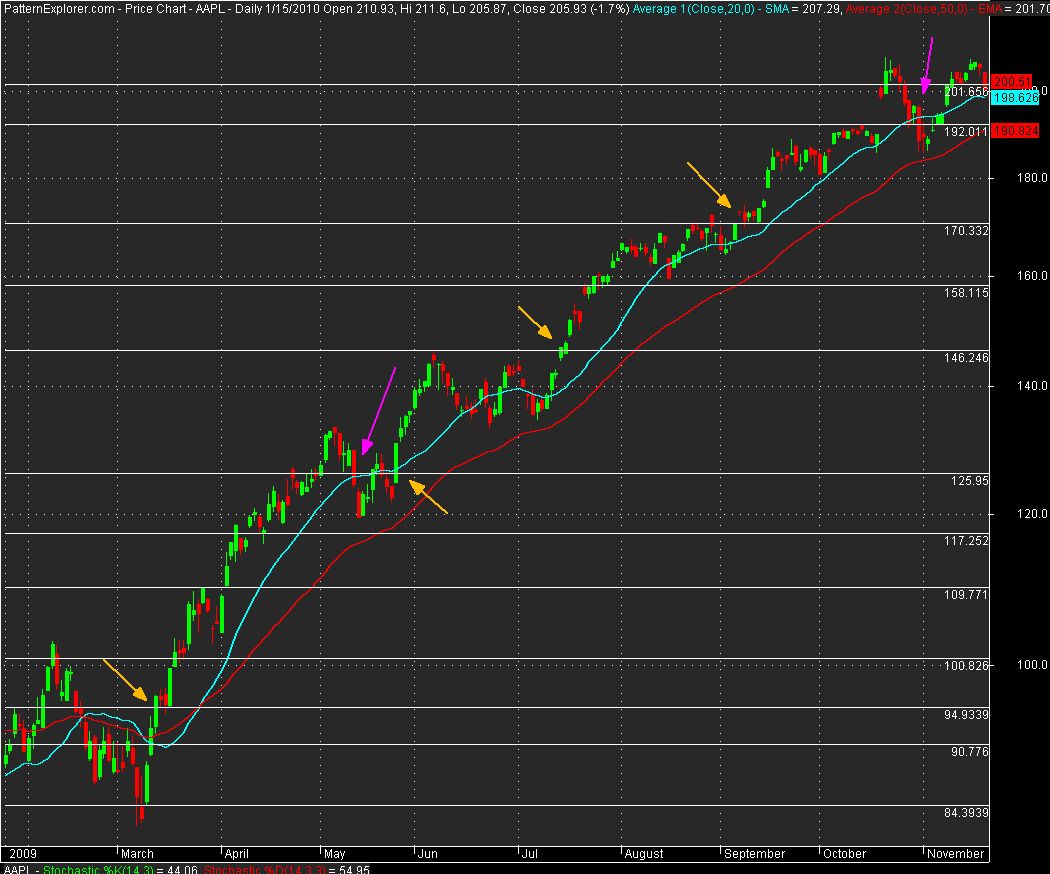
This is the same AAPL chart with a 20 period simple moving average in blue and a 50 period exponential moving average in red. In an uptrend I will sell ½ of my position if price breaks below the 20MA and the nearest support line. If the 50 EMA is breached along with the nearest support then I’m out of the entire position. I’ve marked those areas in pink on the next chart.
Conversely, I’ll buy when price exceeds the 20 MA and the nearest resistance line and I’ll add to the position every time this occurs. I’ve marked these spots in gold.
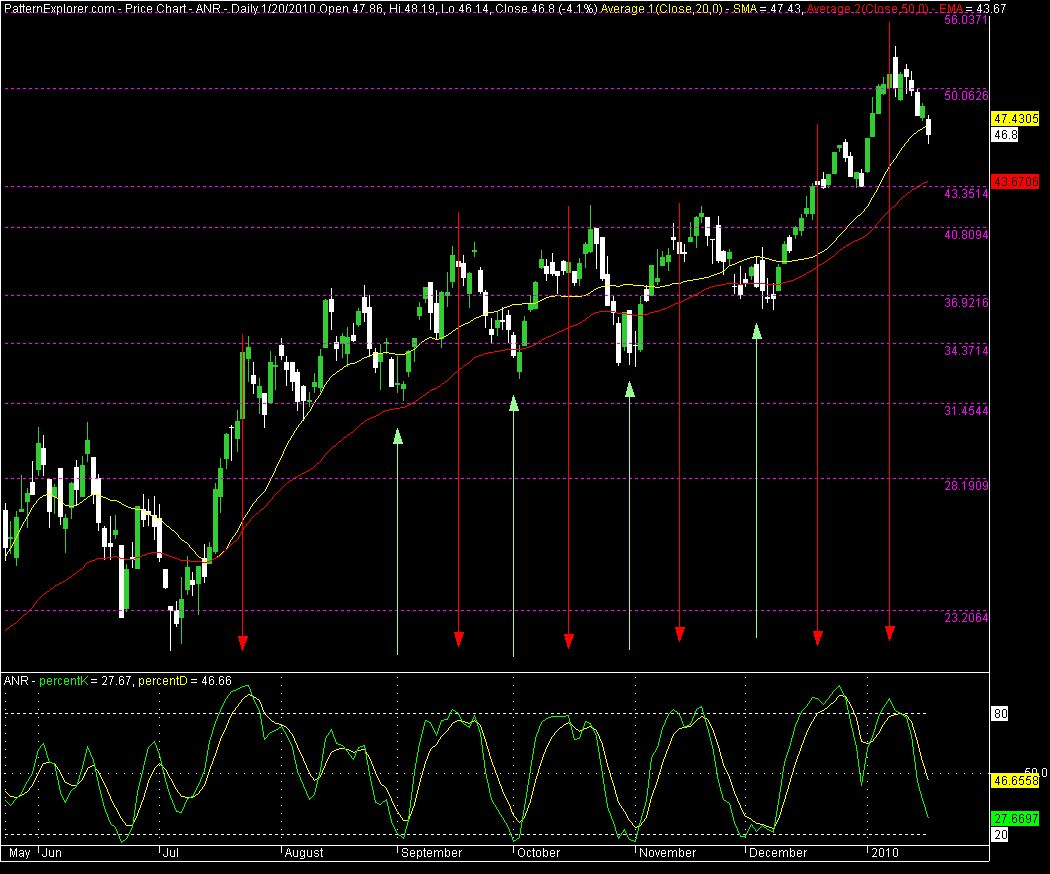
Another strategy I use involves plotting Stochastics on my support/resistance chart. I like the slow %k Stochastics as an overbought and oversold indicator. The settings I use are an 8-3 with an 8-3-3 slow %d. As the indicator oscillates back and forth I watch for readings that are above 80. When the %k rises above 80 then I find my nearest resistance line. I put that stock in a watch list and then wait to see if it will fulfill the rest of my trading requirements to go short.
Conversely, I’ll watch the %k when it nears the 20 level. I find the nearest support and then wait to see if my trading requirements are met for going long.
Here’s a chart of ANR that I’ve marked with the areas I described.
As I write this on January, 21, 2010, the indexes have been moving up one day and moving down the next. There is no perceptible trend. Take a look at my S&P 500 chart – I’ve been watching a 20 point range between support and resistance for quite awhile. Price hasn’t been able to advance past 1148. Today, price broke support at 1128.
Imagine if you had kept support/resistance lines on only the major indexes. You’d be able to make decisions in advance and with more confidence. The more aggressive trader might even take a short position or two.
I hope you’ve found some ideas that might work for you or that you can use to build your own trading plan. Whatever method you use, remember:
Keep it simple.
Make sure that your trading plan is sound and based on verifiable results.
Obey your trading rules without hesitation.
Good luck!
Karen
www.WealthWizardsWorld.wordpress.com
---------------------------------------------------------------------------------------------------
As a kid instead of reading the comics from the newspaper I learned how to read the bid and ask columns from the stock page. My first trade was as a teenager and I got hooked on the idea of money making money. My career spans more than 20 years. After graduate school I did a short stint as a stockbroker and then ventured out and founded my own company. Today I trade only my account and offer advice to a few close friends.
Educational material can be found at my website: www.TradingSystemsSite.com.
Current market commentary on the blog: www.WealthWizardsWorld.wordpress.com
I agree support & resistance is the creme of the crop. I use the Whyckoff method for trading ranges & VSA for trends. I have found indicators work best if we use then to test what we see in a chart. For example in most cases the MACD will cross over from buying in the market such as a breakout, we use that as a set up as the market is over bought then as the MACD has it's second cross, that would be our trigger as long as we see higher lows in momentum, as long as we can locate enough buying in the market that supports the market it's all good. For those that live on indicators, I suggest use them to test prior market movement on what you see in the chart. If a MACD crosses & we look to the left of the chart & we can not locate any buying then sure enough this would be a false breakout because buying of the professionals must support market moves if we are to expect higher prices. I prefer to use channels & trend lines then moving averages however I find moving averages useful for scanning to filter out bad apples from good ones. For swing trading I suggest use the MACD histogram for over bought & over sold areas.. this works well as momentum increases from a pivot low. For momentum trades I suggest buying any down bar in a trend, as long as your trending up & you missed the breakout, you can catch the wave on any down bar as long as the market tries to fall on low volume & can't make the grade. I generally mark any areas of high volume, these would be important areas of support & resistance where there is buying & selling, where professionals are active in the market either selling there holdings into the buying or buying into the selling supporting the market. If we want a more automatic way of trading, indicators can be used but like I said, they are best suited to test prior market movements such as a williams gives a buy signal, we test that as it swings high to over bought then fall & as it falls we wait for it to hold above it's prior over sold giving a false swing indicating the market is to strong to reach over sold suggesting the market is ready to mark up. I find this best suited for those wish to bypass false signals & trade on stronger ones by testing cross overs & what the market what to & is able to do. Plotting support & resistance lines as suggested in this article is good strategy for planning however remember true support & resistance or areas of buying & selling that influences the market carries higher volume activity & these areas must be considered important in the future. This article suggested price clusters in areas of support & resistance.. how true but keep in mind when price clusters, this could be buying before a mark up. When price clusters, something is holding up the market to make no real progress on activity. These areas should not be traded but instead should be tested as price breaks out then falls back down where prior resistance becomes support producing a low risk entry. Break outs are great as a trend starts it's move but in the middle of a channel any breakout should be tested before entry by buying into the next dip otherwise we risk buying into professionals unloading there holdings in what they considered to be a weak market. I find breakout best for areas of accumulation where dips are best suited for when a trend is under way where there is higher lows. If we buy every breakout, we will eventually lose the game therefore breakouts when risk factor is low at areas closer to the bottom in the mark up & dips, pull backs, back ups are best when risk factor is higher near the top of the channel or to extended from it's 50 day moving average.
Hope this helps the newbies!!!
You're looking for a candle that breaks the trend line in the opposite direction. Hope that helps!
Hi Karen,
Thanks for your reply. I have another quick question for you. You mentioned once the trend line is pierced by a candle of opposite color then draw the S / R line across its base. By pierce do you mean a candle that closes above/below the trendline? or just an interesection the trendline is good enough?
Thanks again.
Bobby
Karen,
I've passed this blog on to a few others like myself who are novices but have really tuned in over the last year and one half and now feel ready to enter the market and hopefully the markets are giving us an entry opportunity. My question: do you have any trades going on right now in the market? And if you do can you tell us what symbol so we can examine it with the tools you have given us.
Thank you
The stocks I'm currently trading are: AAPL, AMZN, GLD, WLT.
If you keep an eye on the blog I usually publish a watch list when conditions are starting to come together and new trades are on the horizon.
Hi Karen, Thank you so much for a very interesting and informative article. I'm a newbie and I trade the forex market. I presume your guidelines holds for the forex market as well. In drawing the trendline that initiates a new trend to the upside must all three candles be green? or red in a downtrend? Also why do you ignore the wicks in drawing the trend lines.
Thanks so much, much appreciated.
Hi Bobby,
Yes, this techniques works on any market and on any time frame.
No, the candles don't need to be all up candles or all down candles to draw a trend line.
I ignore the wicks only in the drawing of the trend lines.
I’ve found that the bodies more accurately reflect the median area of support and resistance. Since the wicks reflect the high and low they really are not as representative of where support and resistance may be found, but reflect a margin of error that one should consider when looking at support and resistance lines.
Thanks for the question!
Andy, don't worry about touching every candle's body as you draw the trend line -- three touches make a valid trend line. Draw straight up from your initial candle and see where three touches occur -- that constitutes your trend line.
Using your starting date, March 10, 2009 on the S&P 500 the trend line I draw touches the candle bodies on the 17th, 18th, and 19th. The 20th makes the break of the trend line so put your resistance line at the top of the body on that candle.
You'll see that March 30, 31, and April 1st respect that line as support. The up move starts again and isn't violated until April 7, so you have three candle touches April 1st, 2nd and 3rd with the resistance line drawn at the April 7th candle.
Hope this helps!
thank you Karen.
i am confused even more now 🙂
"Draw straight up from your initial candle"
i think this is what's getting me in trouble
i draw the line "straight up" thru mar 10,12,13 and mar 16 goes under the trendline breaking it, right? so then mar 16 top becomes the resistance as per article "Watch for a red or down candle that reverses the trend. The top of that candle is your resistance line".
what am i missing here? thank you!
Hi Andy,
I sent you a chart along with a reply . . . let me know if you don't see it . . . hope it helps.
Karen
Karen:
Thanks but I have not received the chart you sent.
I did send you my email, so hopefully you can resend it to me.
Thank you!
Andy
Andy, I don't think you're missing anything -- I can send you a chart -- I've left the trend lines so you can see where the break occurs and the resistance line drawn.
I can't attach a chart, but would be willing to send it if you have an email address for me . . .
Karen, thank you for the article.
Question: let's look at the sp-500.
On march 10 there is a reversal and the support @ 680.
So I draw an upward trendline right thru the next 3 candle bodies.
This trendline is pretty steep and will probably never be broken.
As a result, I cant seem to identify a "reversal" day for this.
What am i doing wrong?
Thank you.
I watch a list of about 10 stocks. My "Universe" of candidates (stocks that are under consideration) numbers 300.
I usually have at least 2 trades on, but not more than 5.
When a member of my list of 10 no longer trends in a fashion I can follow then I put it back in my Universe and wait. For example, I trade AAPL a lot. If AAPL would start a long period of consolidation it would go back in the Universe until it broke free from consolidation and looked ready to move.
Hope this helps!
Hi Karen,
Val here once more.
I was wondering whether you tend to trade particular stocks all the time and also would love to know how many stocks/pairs you normally trade and how many do you think we should be looking at to prevent information paralysis happening !!
Regards,
VAL
Thank you for your interesting presentation of support and resistance, which is apparently applicable to all trading markets and all time frames. Is there a general theory that explains why market prices exhibit the support and resistance phenomenon? Surely this is something that has attracted attention in academia. Where might I go to find such information?
Frank, you're right, academia has spilled lots of ink and much debate on the topic. Try doing a search on the laws of supply and demand, or fear and greed in cash markets.
I think an argument could be made that support and resistance lines are graphical representations of emotion. Trading is such a wonderfully awful profession -- as traders we must manage our emotions, but understand the predisposition of the market. If it was only about finding the correct mathematical formula many more traders would be making money.
Well... that is a mouth full. I'm definitely going to spend some time "researching" this on the weekend. Thanks for the food for thought... and I'm excited to follow your blog. I'll be in touch. Thanks.
Great article. Very useful. However I don't think trading is a "war". I think it is more like a "party". You join the party when everyone is joining at the start of the party. You leave when the party is over. You may not be welcome if you arrive to the party too early, or you want to stay around after all other guests have left.
Interesting way of thinking about it TrendFollower -- the parties I attend don't involve people trying to take my money! 🙂
Karen: I do not fully understand the terminology "swing low" and "swing high". Do these represent the turning points in each and every trend?
In essence, yes. The swing high or low is the last high/low point before the direction change -- also called a pivot point. I have an example drawn on my blog in a post entitled, "the old 1-2-3" that might be helpful to you
how 2 access ur blog in d post entitled "the old 1-2-3"
Very nice! Thanks for being so open about your techniques.
Hi Karen
Very interesting information. I have used 8,3,3 on the stochastics previously. I have tweaked it to 7,3,3 as i found this combination to give a better fit lately.
Regards
HL
Karen,
How far back do the ANR support/resist lines originate.
Having trouble replicating.
Doug
The plots for support and resistance on the ANR chart started in 2008.
Nice post, I am currently using a 22, 51, and 200 day moving average for swing trading as this seems to be working best for my parameters at this time given the neutral market conditions. Once we start gaining more volatility towards the up/downside I will adjust my moving averages appropriately. I am now learning about analyzing several doji bars which have been playing a key role in my buy and sell decisions when testing a moving average.
Nice information. Let me get this Stochastic setting correct. My platform shows:
%D Slow (D interval 3, K interval 8)
%K Slow (interval 3
Is this correct?
Thank you in advance
Hi Jerry,
All software seems to be a little different regarding how they label their settings. My settings are really simple: my time period or interval is 8 for both %k and %d and the smoothing or average for both is set at 3.
Hope this helps!
That was K interval 8
most deep you get into this world, more you realize you need to keep it simple!
thanks for remembering us that.
Thank you Karen. I just wrapped up my first year of trading after belonging to two online trading communities. Talk about a head swirly! This, I can connect with.
I felt the same way when I got started, Nan. If you go slow and practice you'll not feel so overwhelmed -- remember, you don't have to know a lot of techniques to be successful, you just need to master a few!
Karen,
Good advice to go slow. I am methodical and my goal is to manage risk and build success step-by-step. Your post untangled the threads I have read all year. I now feel I can assemble a logical chain to follow.
QUESTION:
The MAs throw me off. The MAs on a 3-month chart and a 3-year chart obviously reads differently, thus, buy points aren't the same. When timing buys, do you use a certain MA/time period combination? Or simply the 20SMA and 50EMA. (I'm probably missing the obvious.)
I look at a daily chart with the 20 and 50 MA's. I base my entries and exits based on MA's and the support and resistance lines.
Hi Karen,
I have read your piece about managing Support & Resistance and have to say I am greatly impressed with your ideas.
It makes a load of sense and its something I will now start to look at in more depth.
I assume you are doing this mainly on large, liquid stocks ?
KIND REGARDS,
VAL
Thanks for the kind comments, Val. Yes, I like liquid stocks and use this techniques on stocks with an 20 period moving average volume of 750,000 or greater.