
 If you follow our blog, then you are definitely familiar with trader Larry Levin, President of Trading Advantage LLC. We have gotten such a great response from some of his past posts that he has agreed to share one more of his favorite trading tips as a special treat to our viewers. Determining the direction of the market can be tricky and just plain confusing at times, but Larry’s expert opinion keeps it simple. If you like this article, Larry’s also agreed to give you free access to his favorite technique.
In Tip #14, I talked about some of the basics for technical analysis. Trends and simple chart patterns are just the tip of the iceberg for technical analysis tools. There are many advanced tools that technicians use to try to find signals in the market price. One of the terms you might hear quite often is moving average.
The moving average for a market plots the result of a calculation that averages the prices in a certain time frame. Fans of the indicator say that it “smooths out” the data, giving a clearer picture of potential trends.
The word “moving” refers to the way that new data is added while older points are dropped.
A simple moving average would take the closing prices from a set number of days – let’s say 20 days – add them all together, and then divide by 20. The result can be plotted on the chart. The number of days is usually up to personal preference. The more days used to calculate the average, the smoother the line will be. Here is an example of a 5 day versus a 30 day moving average:
5-day -
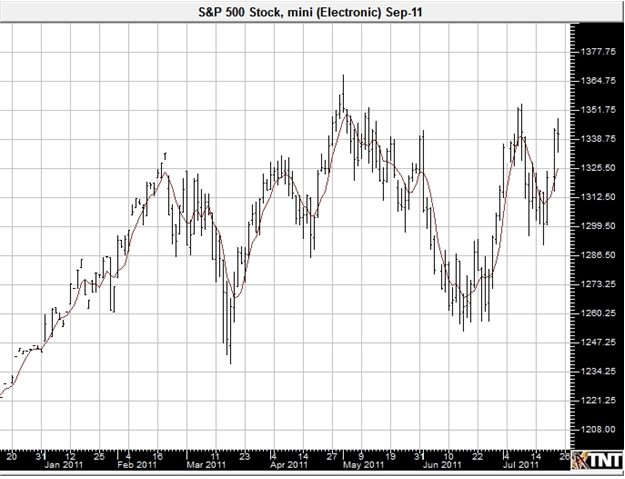
Past Performance is not necessarily indicative of future results. Chart courtesy of Gecko Software.
30-day
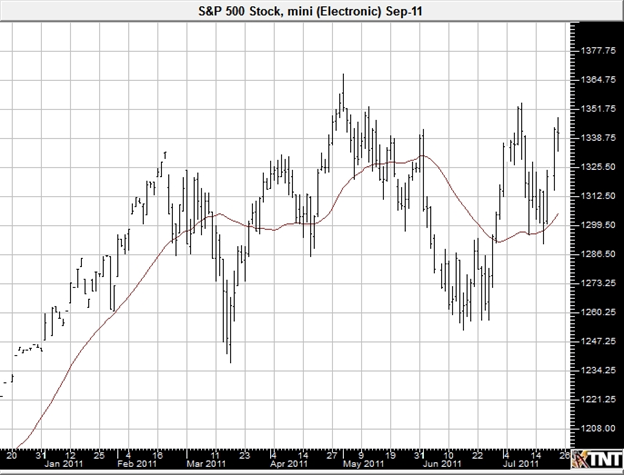
Past Performance is not necessarily indicative of future results. Chart courtesy of Gecko Software.
See how the two compare? The 30 day has far fewer dramatic movements in it. The choice of line usually depends on the strategy that you are looking to use with the moving averages.
Some moving averages use a formula to give recent data more influence on the final numbers. One of these is the exponential moving average, which some computer programs might use if you select this indicator. The following chart shows the difference between a simple moving average (in red) and an exponential moving average (green) where both are calculated for 10-day. See how the EMA looks like it responds to the changes in price faster than the SMA?
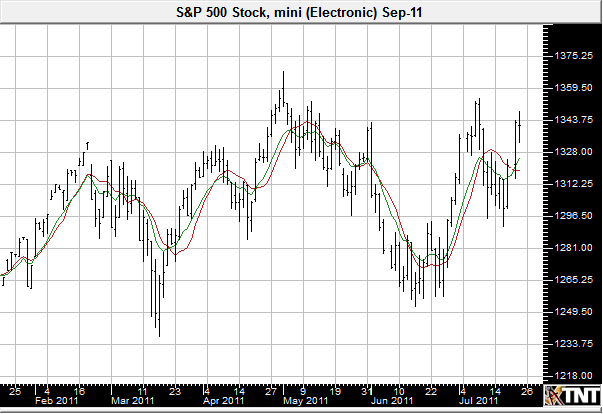
Past Performance is not necessarily indicative of future results. Chart courtesy of Gecko Software.
One of the most common uses of Moving Averages is in confirming trends.
Moving averages use data or prices that are in the past, so they are not really good for predicting trends. The slopes higher or lower in the moving average line can be used to help a technician looking to confirm a possible trend. Take a look at the chart of the 5 day moving average. A trader looking to hold a long position would probably not be comfortable doing so if the current prices were above a downward sloping moving average line. On the flip side of that, a short position would not be on the top of a trend-traders list if the market price was above the line.
Some technical analysts use larger or bigger MAs to try to identify support or resistance. If the market price bounces off the line for a 100 or 200 day moving average, it is a possible spot for support or resistance. Trading opportunities might come into play if the prices crossover that line. Other strategies using MAs come into play when the lines for two different time periods cross each other. In this way the technical analyst will be watching for signs or confirmations of a reversal.
Moving Averages can be used alone or as a complementary tool to other analysis.
Like most technical analysis tools, the moving average for a market can be used in tandem with other analysis. It is a lagging indicator, since it uses price data from the past, so there is reason to keep it handy for confirming trends, rather than trying to apply it in a predictive manner. Keep in mind that different time periods might be more appropriate for specific trading intentions. If you are day trading, it probably wouldn’t be the best use of your chart reading time to use a 50 day MA. You might feel better with something that is an aggregate of minutes or hours. Do your research and practice, and you might find that this simple technical indicator suits your style.
Click here to see one of Larry’s top trading secrets!
Best Trades to you,
Larry Levin
Founder & President- Trading Advantage
la***@tr**************.com
Disclaimer: Trading in futures and options involves a substantial degree of a risk of loss and is not suitable for all investors. Past performance is not necessarily indicative of future results.
Been using MAs for years....... They work if you know how to work them.