
 It would almost seem like MarketClub's Trade Triangles could see into the future, but you won't find any mumbo-jumbo or "black box" technique hiding behind our symbols, just market-conquering technical analysis.
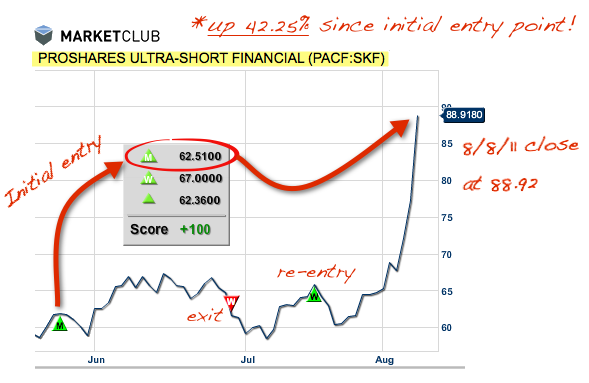
If you tuned into last week's MarketClub TV show, you heard Adam talking about the Proshares Ultra-Short inverse etf, SKF.
MarketClub gave SKF gave a green monthly Trade Triangle on May 24th - nearly 3 months ago(!) with an exit on June 29th (profit of 1.06%). Then, a re-entry point occurred on July 18th and if you bought then, you'd be up 32.71%!
Even if you didn't get in until the morning after Adam talked about it on MarketClub TV, you STILL be up 28.33%!
I don't think we could make it any easier if we tried.
Every success in this crazy market,
Susan Jackson
MarketClub TV Co-Host
Trade Triangles, Email Alerts and a Fuzzy Crystal Ball
Susan / Jeremy
Is there an upgrade release planned soon to differetiate between the alerts sent out via email for positions in one's portfolio(s) to actually correspond to the triangles actual change in direction (especially the weekly and monthly triangles)seperate from other changes in the equity?
I get many alerts that appear to be updates to price when there really has no been no change in the weekly or monthly triangles (red to green or green to red).
Each alert needs to reviewed in further detail to determine if an actual change in a triangle has been triggered or something else because the subject line is rather generic.
In the example above after the green monthly triangle was triggered and alert sent there probably would have been additional alerts sent indicating a green monthly triangle + some other info like the price moved higher when the monthly triangle was actually triggered weeks earlier.
Perhaps I a missing something on how to use the alerts or my ability to differentiate between alerts that have to do with trend changes and alerts that deal with price movements only.
This feature would really enhance the alert service for members to quickly identify those holdings in their portfoilios requiring further attention because a trend has been triggered.
Thanks and keep up the good work.
Mark
Mark,
We do have some upgrades in the pipeline for the Alerts. They will go into effect after we make the switch to real-time data with MarketClub. As it stands, here's how they work.
I believe what's missing is the understanding of the relationship between the alerts, the Chart analysis Score, and the Trade Triangles on the charting.
By setting your alerts to once a day you are going to receive one of two alerts.
1. To alert you of a new Trade Triangle
2. To alert you of new highs/lows off of existing Trade Triangles that are tied into the Chart Analysis Scores.
The Trade Triangle system will not place two Trade Triangles of the same color on the chart at the same time. IE, if you have a green weekly Trade Triangle and a new signal point is reached it will not place another green Trade Triangle on the chart. It will send the alert for a "new high" and the date will be noted in the "Chart Analysis Score" as a new weekly high on xyz. This function keeps you aware of the current trend.
When a trend reversal happens the system will send an alert you of a new Trade Triangle being issued.
I myself also use it this way. I only set alerts for specific symbols that I'm interested in. I do not set them for my entire Portfolio as this would clog up my inbox with a lot info that I'm not looking for. I only want to know about specific symbols when I use the alerts.
Best,
Jeremy
Hi Jeremy,
One of the rules (2) is always use stops and it is frequently mentioned to use appropriate risk management techniques.
What I have noticed is that in a many cases the weekly/monthly triangles will trigger when a trend is almost near a short term top/bottom. For e.g. notice on your chart that as soon as the green monthly was triggered the price dropped, and as soon as the green weekly was triggered the price dropped as well (from 66ish to 60ish, which is almost a 10% move). Allowing a 10% move does not seem appropriate risk management to me (even for a double long or short, which would equate to a 5% move non-leveraged). Am I missing something?
Using this case as an example, let's say you'd entered a position in this when the green weekly triggered, what would an appropriate level to place a stop be for e.g., i.e. what would you consider appropriate risk management? What would you suggest would be an effective way to trade this? It seems to me that if one had set an appropriate stop (4% leveraged maybe?), one would have been closed out of this position...
Thx,
Peter
All comments have to be approved before they appear on our Blog.
As for Stops, the way we use the system is to trade Triangle to Triangle. The exit Triangles are your Stops and you can trust that they will get you out. That being said it's always a good idea to use your own Stop placement strategy depending on your level of risk. Every trader has a different level or amount that they are willing to lose in a trade, you should know this going in and stick to it. If you set a stop at 10% and get stopped out before we exit, that's not necessarily a bad thing if that was your plan.
As far as SKF goes, we are trading Triangle to Triangle using the system without Stops as we are using the exit Triangles as our Stops. We would have rode out that +10% drop to remain in our current position (long)
Best,
Jeremy
jeremy, your explanation doesn't make sense. are the fourth and fifth triangles daily triangle or what. . I only see 3 triangle monthly, weekly , daily. More importantly where are you putting your stops? Stopped out of skf with your system
Flo,
The Fourth and Fifth Triangle's in the Chart Analysis Score are the Weekly (fourth) and Monthly (fifth). For a full breakdown of the Chart Analysis Score go here.
Stops are definitely important given the volatile conditions of today's domestic and international economy. We do not suggest specific loss placements, nor do we place stop loss placement values onto the charts. Given that traders have many different objectives for their individual trading plans, we leave stop loss placements up to the discretion of the trader.
However, since our “Trade Triangles” are used to enter and exit the markets, you can anticipate when the “exiting” triangle will be issued and therefore place your stop loss values accordingly. Our algorithm is based upon various weighted factors; however one of the most heavily weighted factors is the previous three period high or low. With this said, traders can identify the highest high, or lowest low of the previous three periods (daily, weekly or monthly) as a point where the odds are high that an opposing triangle will be issued which would suggest to exit the position.
We suggest that you always use stops, but that you use a method that will best fit your objective and your trading personality. There are many methods for setting stops.
Best,
Jeremy
This post appeared in my inbox with the title truncated to "Triangles or Cry..." I thought it was going to be an article about what may happen when you trade against the triangles! 🙂
MyWealthMastery,
Thanks for sharing. Looks like you got in right around that Trade Triangle re-entry. We get a lot of questions about stops and exit strategies. Care to share yours in this market?
Best,
Susan
Christine,
That's awesome! Thanks for sharing.
Susan
Despite the Monthly and Weekly positive triangles sufficient warning was given on 7/15:
S&P 500
Monthly Trade Triangles for Long-Term Trends = Positive
Weekly Trade Triangles for Intermediate Term Trends = Positive
Daily Trade Triangles for Short-Term Trends = Negative
Combined Strength of Trend Score = + 75
It looks like this market is just teetering on the edge of a precipice. The symmetry of the S&P500 is striking and should not be ignored as we could be making a right shoulder of a much larger head and shoulders formation.
Got in at $67.07. Sitting on pretty good profit at the moment. Thank You
Thanks, MarketClub! I'm actually up over 40% on SKF. Entered on 6/6 (hung on b/c trading monthly triangles) and 7/19. I couldn't be happier with the past days' market action! Just wish I'd bought more!
Hi Suzan,
I am a subscriber to Market Club and I would like to know if it is possible to scan the overall market to get stocks or ETF with monthly or weekly green trade triangles
Thanks
leandre nadeau
Hi Leandre,
In MarketClub there are 2 scans you can use - the Smart Scan and the Recent Trade Triangle scan. If you want to scan for Trade Triangles, I would recommend the Recent TT Scan. You can scan for new daily, weekly, or monthly Triangles as well as specific Chart Analysis Scores. You can also filter by selecting equities (stocks), indexes, mutual funds, forex, or futures. Unfortunately we do not offer the ability to separate out ETFs at the moment, but you will find them under equities.
Best,
Susan
p.s. If you have any other questions, feel free to email support [at] ino.com or call 1-800-538-7424.
i had a big loss following ur crystal ball triangle on s&p500
ur triangles were wrong 🙁
Sam,
I'm sure how your trading the S&P using the Trade Triangles, but you shouldn't be losing money at the present time. We got Short the S&P on 8/2/11 @ 1,258.07 on a Monthly Red Trade Triangle. Remember we trade the S&P and all indexes using our Long-Term Strategy as noted below.
Monthly Triangles determine trend and possible entry points.
Weekly Triangles determine timing: exits, entries and re-entries.
The last triangle issued on the monthly chart should always be used to identify the overall trend. You can also use the monthly triangle as a potential entry point if you can get into the market within the last 3 trading days of the signal. Then you are to look at the weekly triangles for possible exit and re-entry points, or entry points if your monthly is in a steady trend.
Key Rule: always trade with the trend. Make sure your weekly and monthly triangles correspond in direction.
*If you are a shorter term trader, it is possible to use the weekly triangles to determine overall trend and possible entry points and the daily chart to determine individual timing points. Please be aware of the short term whipsaws, and lack of overall trend strength.
As a intermediate-term trader you want to pay particular attention to the fourth Triangle. This is the fourth Triangle from the top that will generate positive or negative intermediate-term signals for you. If the forth Triangle is GREEN, you should then confirm the signals viability status with the color of the fifth Triangle. If both Triangles are GREEN, then a positive movement is likely. However, if the Weekly and the Monthly Triangles are RED, then a negative movement is likely. If the Triangles differ in color then you should consider keeping a sidelines position.
How It Works
The direction of the forth Triangle is marketed whenever a market moves over the previous three week high and remains above the previous three week low. The reverse is true when the low of the previous three weeks is broken to the downside, it creates a RED Triangle . This is an automatic stop-out of a long position if the fifth Triangle is GREEN. If the fifth Triangle is RED, it signals that a short sale is in order. If you are not familiar with short positions please consult your broker, or learn more from the experts in our INO TV online seminar service.
5 Successful Intermediate-term Trading Rules
(1) The odds are in your favor when you trade with the major trends.
(2) Always trade using stops. Never Cancel A Stop.
(3) Plan your trade and trade your plan.
(4) Never assume a market is too high or too low.
(5) Go with the flow. Don’t over think your position.
Best,
Jeremy