
F rom time to time we here at INO.com come across someone in the industry that grabs our attention. Recently we saw a post from Guy Cohen about a trade and how he had called the breakout for sometime in advance. How he caught the breakout was intriguing and we asked him to share a bit about the trade with traders blog readers.
Guy Cohen is a bestselling author of several trading books, and the creator of the OVI Index, Private Traders Club, and Flag-Trader. His clients include NYSE Euronext, The International Securities Exchange (ISE) and FT Prentice Hall.
Guy is also holding a special webinar for Traders Blog readers tomorrow Thursday 9/22, for more information click here.
Read below how a small band of traders had THREE weeks advance notice of AMZN’s potential breakout … and how they cashed in!
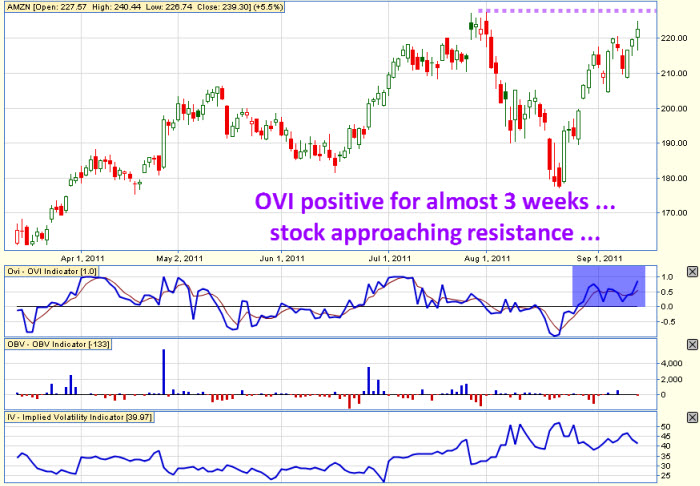
My private students already knew I was a fan of AMZN for some time. Why was I so keen? Well, two reasons. First because my OVI indicator was persistently positive on the stock as it rebounded from its August lows, and second, the stock was inexorably rising towards its July highs.
So, while the broad market was having a positive time last week, we’d been watching AMZN since late August when it appeared to have turned the corner. But that’s not where the trade happens … what we need is a break of resistance.
Looking at the chart below, you can see how AMZN was approaching its July resistance level, and how the OVI had been consistently positive for over THREE WEEKS!
It was on September 7th when I alerted my private traders that AMZN was looking seriously interesting.
The OVI had been positive for a while already and it was clear that the stock was in an uptrend of sorts. What we now needed was a break of resistance.
Let's see what happened next!
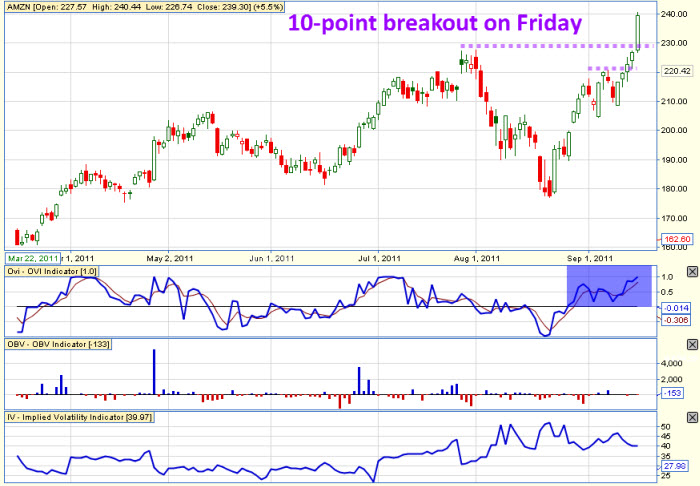
Bingo … a clear breakout of more than $12!
And emails from my members are still rolling in, detailing how excited they are over this trade and how easy it was for them to identify and execute.
Let me recap why my members and I could see this setup so clearly:
It’s all about the OVI and a pattern happening at the same time.
The OVI is derived from options transaction data, and plots it as a simple line that oscillates between 1 and -1. When the line is positive we’re more inclined to observe bullish chart patterns and when it’s negative we focus on more bearish chart patterns. We only use it in combination with a chart pattern such as a consolidation or flag.
With its uncanny ability to mirror trending stocks almost to the day, the amazing thing is that the OVI actually has nothing to do with the stock price! And yet the correlation is often astounding … and in many cases the OVI can precede the stock price, especially when we’re using it with breaks of support and resistance.
Used correctly in conjunction with chart patterns the OVI demonstrates that the options markets are often ahead of the stock market. And when you are armed with that information, along with the proper trading plan, this can be a MASSIVE advantage … and you’ve seen here with AMZN
I am holding an exclusive LIVE Session this Thursday at 9PM EST where I will show you how to harness the power of the OVI for YOUR benefit.
If you want to be ahead of the market weeks before the next 10-point breakout, I urge you to attend as I can guarantee it will absolutely change the way you look at the markets forever!
Click Here To Register For This Free Event!
All the best
Guy Cohen
this indicator does not help in this trade at all. As a matter of fact the actual so called breakout was getting in late. When it had pulled back mid August and started to creep back up and then gapped up late August this was a confirmation of the stock going up and any pullback from there could be bought with confidence. At the time it broke the top area of resistance it was the fifth straight day up and that was the opportunity to make the final play intraday and sell it near the highs intraday. Most indicators are derivatives of prices and are lagging. As stated before in a prior post the price pattern was all you needed.
You didn´t need such an indicator to spot the breakout on AMZN or AAPL, just the breakout pattern and the price confirmation was enough.
It is indeed interesting to see that when the OVI and pattern happening at the same time - we are able to identify the trade. I would love to attend but afraid the timing is out for me. Is there a video of the 'live' session?
"Interesting" must have a new meaning.