
 Today's guest post is from our friends at the Benzinga News Desk. Today they are going to ponder the age old question of fundamental or technical analysis and discuss the Elliot Wave Principle. Be sure to comment below with your own thoughts and learn more about the Benzinga News Desk here.
Investors and traders have been arguing for the longest time about which overarching strategy is king: fundamental analysis or technical analysis. Long-term investors believe that technical analysis is trash and nothing more than lucky betting, while short-term traders think that fundamental aspects of companies and economies do not matter for short-term price movement.
The reality is that both techniques are useful; fundamental analysis can help you determine which equity is a good investment while technical analysis can help you figure out the entry and exit points.
An interesting technical analysis indicator that attempts to predict market psychology, and more importantly, market movements, is called the Elliott Wave Principle. The indicator, developed by Nelson Elliott, was created to track collective investor psychology.
The model proposed by Elliott is based impulse buying and selling, and purports that human reaction tends to be very repetitive. The basic structure of the Elliott Wave's in context of the market looks like.
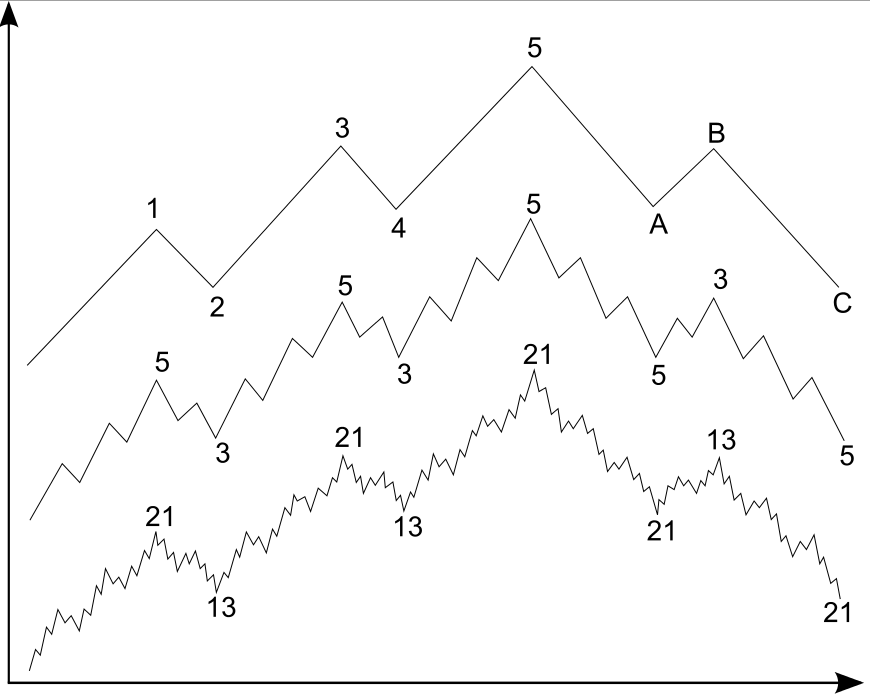
The top pattern is how the trend generally works when Elliott Waves are triggered. However, no stock moves straight up or down, there are always minor aberrations when stocks move.
Based on mathematic patterns called fractals, Elliott determined that each leg up and down are composed of smaller Elliott Wave patterns, complete with the 5 legs in the upward trend and 3 legs in the downward trend. The Elliott Wave principle became especially famous in the 1970s when Robert Prechter predicted the stock market crash in 1987. Since then, thousands of traders have relied on the patterns to determine macroeconomic trends.
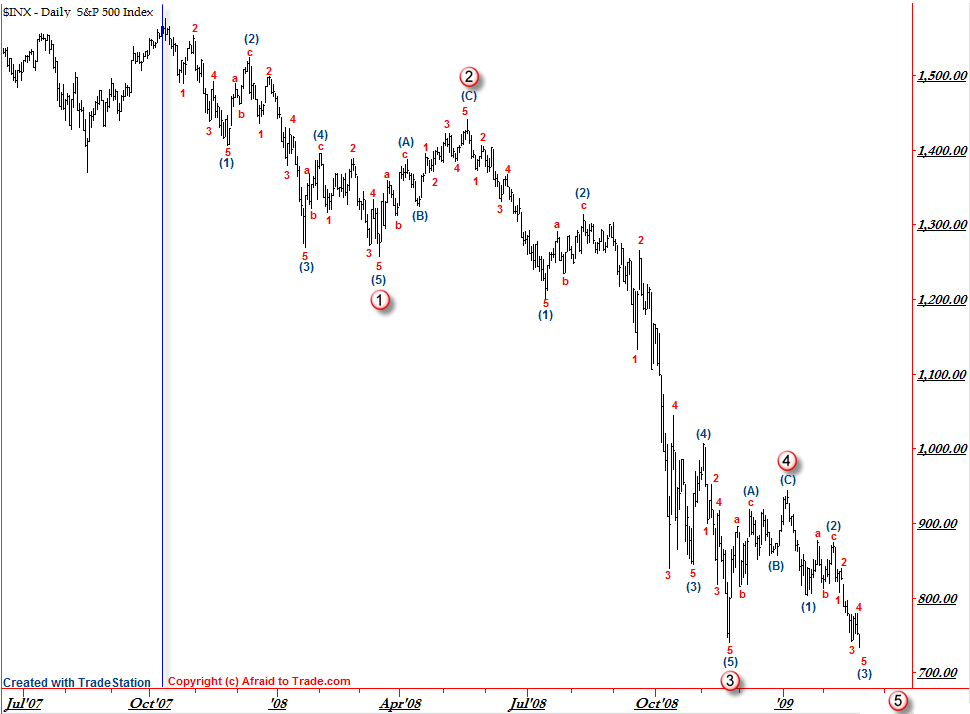
The Elliott Wave theory can be applied to many real-life situations. Looking at a chart of the 2008-2009 crisis, it is easy to see how weekly analysis of trends in the S&P 500 could have predict downward movement. From point 1 to point 2, we see a large move upwards. However, after point 2, the move downward is clearly seen. Even looking at smaller time frames, like daily charts, can help day-traders make moves in between weeks, as point out by the small, red numbers. In all practical senses, the Elliott Wave indicator can be applied to various time frames, and can be used by day-traders and long-term investors alike.
Understanding what is happening to the greater economy is more important now than it has ever been. It is extremely important for traders to be able to figure out when the market is going to trade upwards or downwards, and Elliott Wave analysis may be an appropriate indicator. It is important to make sure that the theory fits with your trading style and makes sense to you; otherwise, it will never work out.
Good luck,
from elarning and applying excellent chart , elliot waves works but trader loose patience
from a learning point of view not the greatest post.
The key statement is "5 legs in the upward trend and 3 legs in the downward trend" yet this is not (primarily) visually demonstrated - the chart shows an overall down move and the smaller groups of 5 cycles are also down.
I have noticed Adam uses his version of this when he counts the moves off the charts - I am sure I have seen him count five up then a drop, five up then a drop and so on so I guess he is using his interpretation of Elliot on these occasions?
Also it says the theory "became especially famous in the 1970s when Robert Prechter predicted the stock market crash in 1987" - back to the future!
I have found Elliot Wave way too subjective.
Even Robert Prechter's group has trouble being accurate.
You are better off in my opinion using basic
technical analysis along with watching
the macro economic events for sentiment
indications.
I think people need to realize that if you solely use Elliot Wave alone with no other indicators, then yes, it probably will lose you money. The one thing both Fundamentalists and technicians will agree on is that you need more than 1 confirming indicator. No fundamentalist would trade on P/E ratio alone. And no technician should trade on Elliot Wave alone. Elliot Wave is a tool used to help you determine the direction of the market and like all technical indicators, maybe help with some entry and exit points. It is not meant to be a predictor of the market. Sure, if you put 5 Elliot Wave techs in a room, you may get 5 different starting and stopping points of each leg, but I bet the overall trend of the market would be the same.
Have subscribed to many elloit wave servics. This will lose you money. It is analysis after the fact. Put 5 elloit wave techs in a room and you will get 5 different views.
Wave 4 look a little bit too short in time and length, would bet on a 30 pct rebound from here to complete wave 4 and then 500 ???
Like seeing the future!