
 Today the Trader’s Blog welcomes John Crane of Traders Network. John Crane has been an active trader for decades, and is the president and CEO of Traders Network - a firm providing brokerage services, educational training products and technology for today's intelligent investor. Articles on his trading concepts have been published in Consensus, Barron's, Technical Analysis of Stocks and Commodities as well as The Wall Street Journal, Investor's Daily, and Traders World. John has appeared as a guest lecturer at several national trade shows where he taught combines his highly acclaimed “Action/Reaction” market timing methods, using a selective set of Elliott Wave and Fibonacci principles to analyze the market action and future market swings.
To learn more about Swing Trading with Market Timing Intelligence click here.
Today he's going to talk about how traders need to understand how market structure can affect market behavior.
“Man masters nature not by force, but by understanding.” This quote may be about nature, but it also holds true when it comes to swing trading. Before anyone can master the markets, they need to understand how market structure can affect market behavior. With all the technology and computer power today, traders have come to rely on subjective or lagging indicators to make most or all their trading decisions and have not taken the time to learn and understand the value of past price action and its influence on future market movements. I believe a basic understanding of how market structure and market behavior affect the market will enhance any trading style or methodology.
Before I go further, let me define what I mean by market structure. I define market structure as a sequence of patterns that make up a tradable predictive pattern. Most traders will use a single price pattern, such as a flag or pennant, as their only pattern indicator, when a specific pattern sequence can be a much better predictive indicator.
Right behind market structure in importance is market behavior. Understanding how the market should react, after a specific market pattern sequence has been confirmed, will alert you quickly to a legitimate signal. Just as important, it will also alert you to the possibility that the signal pattern may fail. Combining knowledge of both market structure and market behavior can help identify significant trading opportunities early, as well as prevent trading disasters before they occur.
One of the most powerful trading methodologies, using the market structure and market behavior, is the combination of the “Action/Reaction” theory and the Reversal Date indicator. Known as Swing Trading with Market Timing Intelligence, this methodology uses only the past “action” of the market to make predictive time and price projections, with a high degree of accuracy. Instead of going into a long drawn-out explanation of the repetitive natural cycle behavior in the market, I will just use the following chart illustrations and let them speak for themselves.
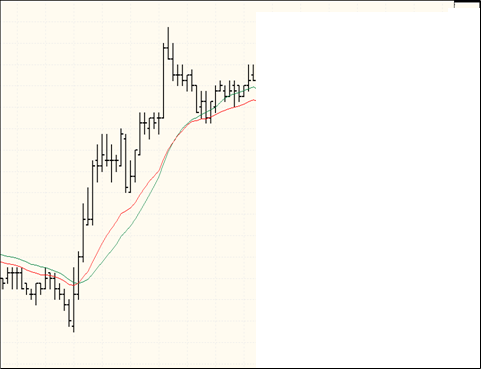
The first thing that really jumps out about this chart (Figure #1) is the lack of data. I am only showing half the chart. The right side is missing. I would also like to point out that I have not identified what market or time frame is represented on the chart. This illustrates how the “Action-Reaction” method can be applied to any market and any timeframe. Whether you are a day trader, swing trader, if you trade commodity futures, equities or Forex, the “Action/Reaction” method can be added to your current trading methodology. That’s right; it can be used as a stand-alone tool or added your own trading approach. It is a truly flexible trading strategy. The price action and market structure shown provide all the information needed to make a future projection of the next market direction, price objective and duration of the impending price move.
It begins at the “reaction swing”. The reaction swing is the balancing point of the cycle. It is the point at which the action (the price action that has already occurred) segment of the cycle ends and the reaction (the price action about to occur) segment of the cycle is about to occur. By understanding the information provided by the action segment, I can make a predictive projection of the future price action. Here is how it works:
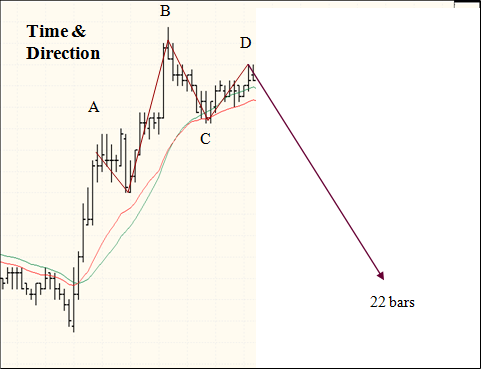
In (Figure #2) I have marked the five pivot points that make up a pattern sequence called a TR pattern (Trend Reversal). The five pivot points are marked as A, B, C and D. To qualify as a TR Pattern the pivot points are in a specific order. The TR pattern typically appears at a major high and or low of a trend, or it can mark the center of a longer-term trend…on of my favorite patterns.
Since the market traded higher, into the reversal date marked as (D), I can surmise the next price direction is down. Therefore, I have the “direction.” The next step is a time/price measurement from the beginning of the reaction swing marked as (C) back to the beginning of the pattern sequence, marked as (A). Starting at (C) I count the price bars back to the beginning of the TR pattern marked as (A). The count equals 22 bars. I take this number and project forward 22 bars from the end of the reaction swing, marked as (D). This gives me a time projection of 22 price bars in the future. Now I am looking for a downward price swing that could last for 22 price bars…I have a market direction and a time objective.
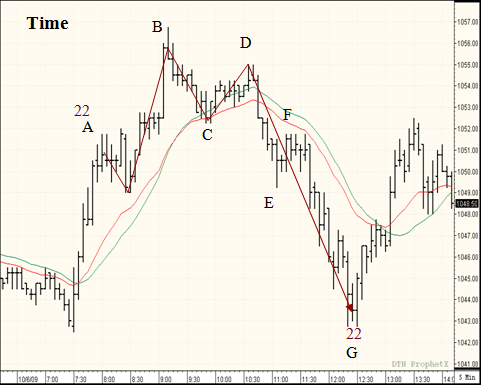
Now that I have the direction and duration of the upcoming price move, I want to know a probable price target objective. To find the price projection, I turn to the Andrew’s Pitchfork and anchor it at the high of the TR pattern, marked as (B). The two parallel lines are drawn from the high and low of the reaction swing marked as (C) to (D). I am most interested in the center line known as the “median line.” I use this as a momentum indicator to determine strength or weakness of the market. Using the information I already derived from the time/price measurement, I count forward the 22 bars, from (D), and mark the median line and the lower parallel line. On this mark, I draw a line parallel to the line drawn from (C) to (D), by the Andrew’s Pitchfork. This sloping line is called the “reaction line” and will be the price target objective. I have now had my future projections for the direction, time and price of the forthcoming price move. Figure #3 shows how the market traded lower for the entire 22 price bars, before posting a double bottom and reversing the trend…on the predicted price bar!
In Figure #4, after a short-term pause between price bars #6 and #8, the market resumed the downward trend and crossed over to the weak side of the median line on price bar #15. This indicates more weakness and therefore, the reaction line is lowered to where the time projection intersects the lower parallel line to provide a new price target objective. You can also see this is a 5-minute chart of the E-min S&P.
The final result, of my time and price projection, is shown on the following chart of the 5-minute e-mini S&P chart. The reaction segment of the cycle traded lower over the 22 price bars and posted the lowest closing price on the 22nd price bar, but not until the market had reached the reaction line target objective. Remember, both time and price objectives had been projected 1 hour and 40 minutes earlier. This effectively ended the cycle and the market promptly reversed where the current reaction cycle had ended and a new cycle was about to begin.
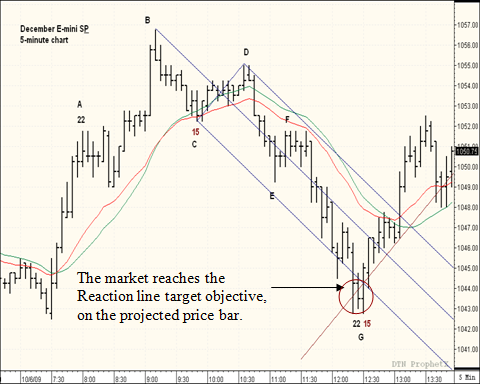
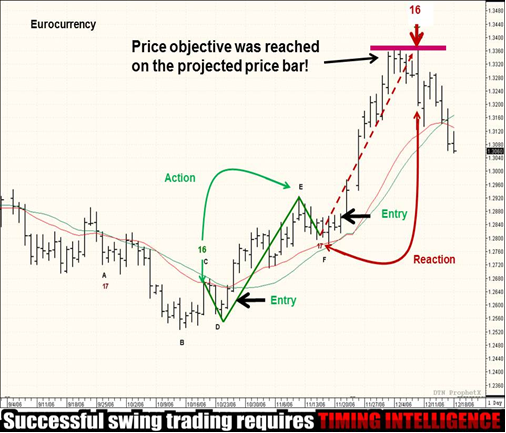
Figure # 5, is a daily chart of the Eurocurrency and illustrates the flexibility of Swing Trading with Market Timing Intelligence and its ability to help with the critical timing of both entries and exits of a trading signal. The balancing point of the entire reaction cycle was determined to be the reaction swing marked as (E to F). By combining this information with the “Action-Reaction” market timing method and a selective set of Elliott Wave and Fibonacci principles, I was able to make the precise market projections that proved to be the critical turning point in this market.
These are prime examples of the importance of understanding market structure and market behavior. Since buyers and sellers are the true drivers of the market and human fear and greed will never change, the emotional cycles will always exist in a measurable and definitive way. With the “Action/Reaction” theory and Market Timing Intelligence you can use these patterns sequences and market behavior to enhance your current trading approach or as a stand alone indicator. This methodology is the foundation of the daily trade recommendations made in the Traders Market Views Swing Trade report and also for the highly acclaimed RT Swing Trade software.
Click here to learn more about Swing Trading with Market Timing Intelligence!
John Crane
President and CEO of Traders Network
Disclaimer: Trading involves a substantial degree of a risk of loss. Past performance is not necessarily indicative of future results.
This technique is amazing.
Please, use it to tell us where the ES will be one month from now.
Kind regards,
Jason
Your presentation is great. I want to use it for stocks initially. Please guide me.
Thanks
Santosh
Hi Santosh,
I think you'd find a link to our Help Section to be of some assistance: http://club.ino.com/trading/marketclub-help-section/
There is a section that explain how we use our tools for equities. One great thing about MarketClub is that the tools can used in different ways to help you trade a variety of markets.
Take a look at the Help Section and let us know if you have any questions by submitting an email to
su*****@in*.com
.
Thanks,
Lindsay Bittinger
INO.com, Inc.