
 Today we've asked our friend John Seguin to discuss his groundbreaking trading strategy. John has been member of the Chicago Board of Trade (CBOT) since 1986 and is a seasoned veteran of the trading floor. Working as a broker and analyst for dealer firms such as, DCNY, Greenwich Capital, Sanwa Bank and FIMAT. During his tenure in the trading pits, John began working on an enhanced trading system to address the key components needed to enter high probability trades with defined risk. When industry migration from floor to screen began to unfold, he also took the challenge of producing sound and timely trading strategies for off-the-floor traders to task seeking alternative methods to fill the void of real time information floor traders were able to collect from watching order flow in the trading pits. John has agreed to give our Trader's Blog readers free access to the macrograph charts for two weeks.
Over 20 years of servicing institutional traders from all over the globe gave me a framework to create trade strategy. As a broker at the CBOT I reported price action such as bid size, offer size and volume throughout the trading session. By watching the auction process and reading hand signals I was able discern whether buyers were lifting offers or sellers hitting bids. In other words I could read momentum in real time. It was a huge advantage watching order flow in and out of the pit, mainly because I could put a name on a trade. Generally locals or pit traders were very short-term oriented looking to make a tick to a few ticks per trade. They were often rewarded an edge (buy the bid side or sell the offer side) for providing liquidity to the institutional traders and most were flat at the close of the session. The point is they did not move markets directionally for long. It is the entrance or exit of institutional money that move markets and subsequently determines momentum. Now that nearly all futures volume is executed on screens the dilemma is how to determine large capital flows without the benefit of information that unfolds in the pits.
In the mid 80’s I began using Market Profile. After researching and using many technical tools (bar charts, point & figure, candles) and indicators (MACD, MA’s, RSI etc.) I found that MP was the tool that allowed me to interpret the auction process on a screen much like I was reading the trading pit.
There are many variables to consider when designing trade strategy. This article will focus of 2 vital components involved in order to read price action and create a pragmatic approach to trading. The first, fair value is simply the high volume price. The fair value area covers a standard deviation of volume around the mean or fair price. Traditional MP was designed breakdown the day session into 30 minute periods from which a bell curve using letters was constructed.
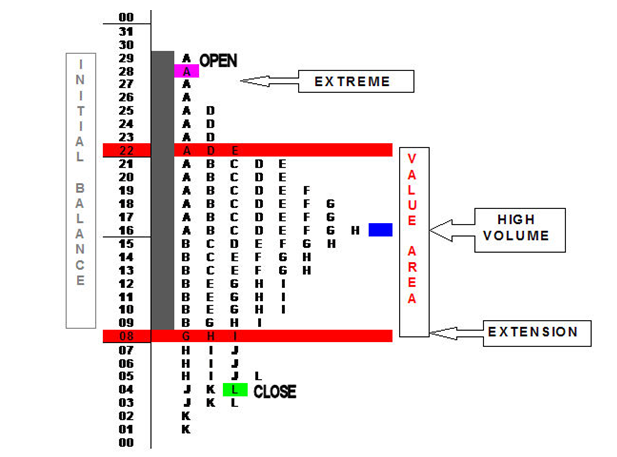
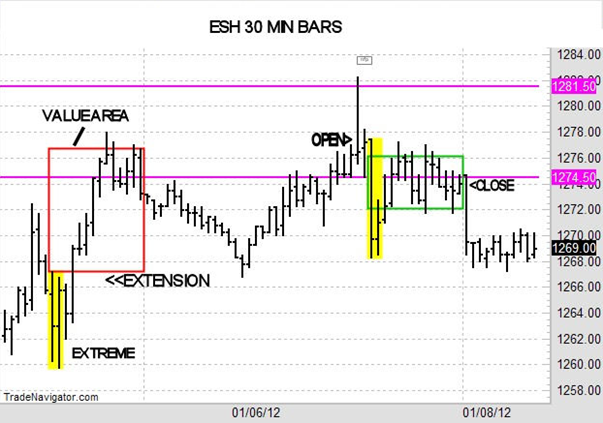
I do not use day Market Profile any more but I do utilize the logic behind the tool. The graph below shows my short-term tool for analysis. These charts allow me to track fair value and momentum. I am able to note periods when and where institutional traders are traditionally active. Typically institutional accounts are active during the most liquid time of the day or the 1st hour (initial balance) and it is shaded yellow in the graph below. The value areas cover roughly 70% of the volume around the mean or high volume price. The top and bottom of the value area are institutional hot spots. As a rule an extension after the initial balance is attributed to the influx or exit of institutional capital. And lastly the close in relation to the high volume price is also and indication of bull or bear force. Momentum is simply the movement away from fair.
I use this short-term tool in conjunction with Macrograph, a unique charting tool that generates bell curves from days to years. I think it is imperative to have a long-term perspective so I view weekly, monthly, quarterly and even yearly graphs often. Patterns repeat in all markets and all time frames. Therefore if the short-term signals work why not apply that same proven logic to longer time frames.
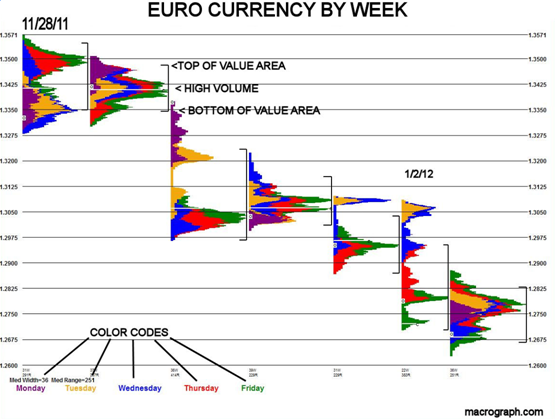
Where letters are used to represent each 30 minute period of the day, Macrograph uses color to distinguish each day of the week or week of the month or month of the year. Colors allow the viewer to follow momentum.
Notice in the graph how often high volume prices provide support or resistance. When retesting old high volume prices I refer to the short-term signals mentioned above to check if institutional players are showing interest. The week following 11/28/11 opened beneath the previous high volume prices and rallied to them. After hovering for a couple hours sellers took over and pushed the market below the fair prices of the day and week, confirming that bears control momentum in 2 time frames. As long as a market hangs below the top of the value area in a falling market shorts are warranted. The bottom of value defines risk in a rising market.
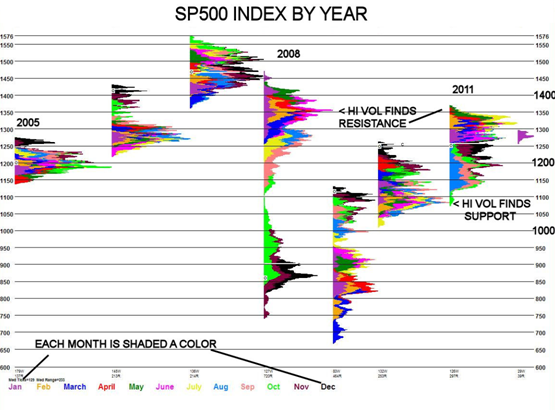
The SPX yearly chart shows that bell curves are prevalent in all time frames and that very low and very high volume prices tend to provide support / resistance. When testing such areas it is not an automatic buy or sell signal. However it is time to check your short-term signals to see if you get the response you are looking for.
To test out John Seguin’s very own AutoSystem in your portfolio click here.
Every Success,
John Seguin
Macrograph.com
Disclaimer: Trading stocks involves a substantial degree of a risk of loss and is not suitable for all investors. Past performance is not necessarily indicative of future results.
I find this very interesting but must read it serveral times more