
 Today’s guest is Markus Heitkoetter, CEO of Rockwell Trading and author of “The Complete Guide to Day Trading.” Today Markus is going to share with you Part 1 in a series of articles on what he believes it takes to be a trader. We already talked about it in the previous article: Being able to determine the direction of the market is one of the most important skills of a trader, because it dictates the type you trading strategy you use. In a trending market, you want to use a trend-following strategy. And in a sideways market, you want to use a trend-fading strategy. For more information on this topic please read the previous article "How To Be A Trader - Part 2"
How To Identify The Direction of The Market
Way back in the 90s I used fundamental analysis to try and predict the market. Long story short, it didn't work for me.
Since the mid 90s I have been using technical analysis in my trading. When using technical analysis, there are two different approaches:
- Chart Patterns and
- Indicators
Examples of chart patterns are flags, pennants, triangles, double bottoms and tops, etc. Candlestick formations are chart patterns, too.
Examples of indicators are moving averages, Bollinger Bands, MACD, RSI, etc.
So which approach is "better"? Should you use chart patterns or indicators to identify the direction of the market?
Easy answer: Use the approach that works for YOU. I personally use indicators. I like the black-and-white approach of indicators. As an example, the RSI is either above 70 or it is not. There's no grey area. I openly admit that I struggle identifying chart patterns while they are forming. Don't get me wrong: I am an expert showing you every single chart patter there is at the end of the day. But I can't identify them with certainty while they are forming. But hey, I can't ride a bicycle either, so maybe there's something fundamentally wrong with me 
Using Indicators To Identify The Direction Of The Market
In my own trading I use Three Indicators to determine the direction of the market.
Today we will talk about the my favorite indicator - Bollinger Bands. Bollinger Bands are a fascinating concept. They are available in EVERY charting software.
Note: If your charting software does NOT allow you to plot Bollinger Bands on your charts, it's time to switch to a different software provider. Let me know if you need help finding a powerful charting software platform
Back to Bollinger Bands. Bollinger Bands consist of a Centerline, which is a simple moving average, and two standard deviations. One above the centerline and one below. These are called the Upper Bollinger Band and the Lower Bollinger Band.
I like to use a setting of 12 for the moving average and a setting of 2 for the standard deviation.
And here's how to use the Bollinger Bands:
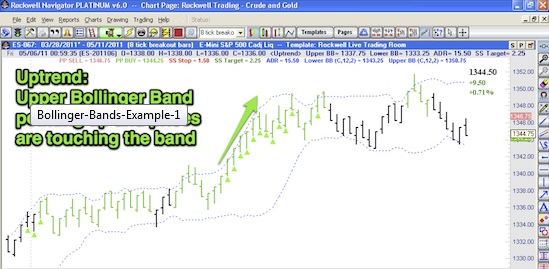
In an uptrend you will see that the Upper Bollinger Band in pointing up in a nice 45 degree angle and prices are touching the Upper Bollinger Band. The Upper Bollinger Band acts like a trendline ABOVE the prices.
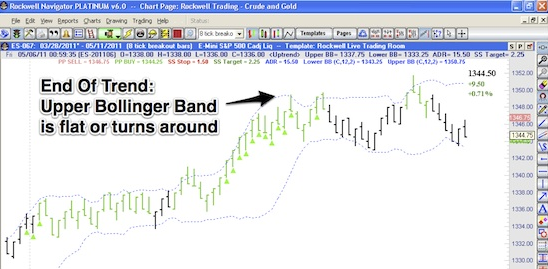
So how do you know when an uptrend is over?
The uptrend is over as soon as the Upper Bollinger Band flattens or turns around.
In a downtrend you will see that the Lower Bollinger Band in pointing down in a nice 45 degree angle and prices are touching the Lower Bollinger Band. The Lower Bollinger Band acts like a trendline BELOW the prices.
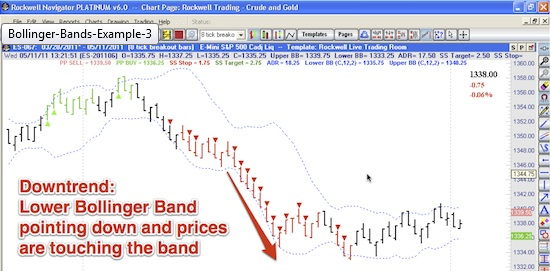
And the downtrend is over when the Lower Bollinger Band flattens or turns around.

Try it out for yourself!
- Pull up your charting software, plot the Bollinger Bands on the charts with a setting of 12 for the Moving Average and 2 for the Standard Deviation
- You can use it with ANY timeframe, but if you are day trading, you might want to use a five (5) minute chart.
- Look at the current value of the Upper and Lower Bollinger Bands. Based on the definition that I gave you above, what is the market doing right now? Is it in an uptrend or in a downtrend?
- Now look back at charts. Can you see how the Bollinger Bands are showing you the trends?
You shouldn't have ANY difficulty to determine whether a market is going up, down or sideways based on this simple definition. If you do have problems, let me know and I'll be happy to help.
Keep in mind that this is NOT a trading strategy in itself! It's just a way to determine the direction of the market.
Summary of "How To Be A Trader Part - 3"
You can use chart patterns or indicators to help you identify the direction of the trend. I personally rely on indicators because for me they are more "black and white".
My favorite indicator are the Bollinger Bands. They offer me an easy way to determine whether the market is trending or going sideways.
Markus is CEO of Rockwell Trading and author of the international bestseller “The Complete Guide to Day Trading”. For a limited time INO Blog Readers can download his book free here.
Well explained. BB is often an under-estimated indicator, but a very useful one.
Used with RSI, MACD and VOLUME, for conformation, I think Bollinger Bands do a great job.
could you, please, be more specific?
how you use the bollinger to decide whether to enter or exit?
If Bollinger Bands actually behaved the way Markus illustrates them, trading would be simple and easy. But the truth is that prices very often oscillate back and forth between the upper and lower bands, or between one band and the central moving average. These oscillations may or may not offer opportunities to the swing trader. What's needed are filters to reject bad trades and validate good ones. Another necessity is a beneficial risk-reward calculation before the trade is entered. A third necessity is a money management system that maximizes profits and minimizes losses.
Not worth reading