
Today, I'm going to be looking into the stock of Texas Instruments Inc. (NASDAQ:TXN). I found this stock using MarketClub’s Trade Triangles scan, scanning for new weekly Trade Triangles. Since the monthly Trade Triangle was already green, the new green weekly Trade Triangle today is an indication that the intermediate term trend is now in sync with the long term uptrend. It indicates that all systems are go and the upward trend has resumed for Texas Instruments.
This in-depth analysis of Texas Instruments Inc. (NASDAQ:TXN) is for educational purposes only. I am seeing certain technical elements that are falling in place that look extremely promising for this stock.
What Does This Company Do?
Texas Instruments Incorporated engages in the design, manufacture, and sale of semiconductors to electronics designers and manufacturers worldwide.
Chart Legend & Technical Picture
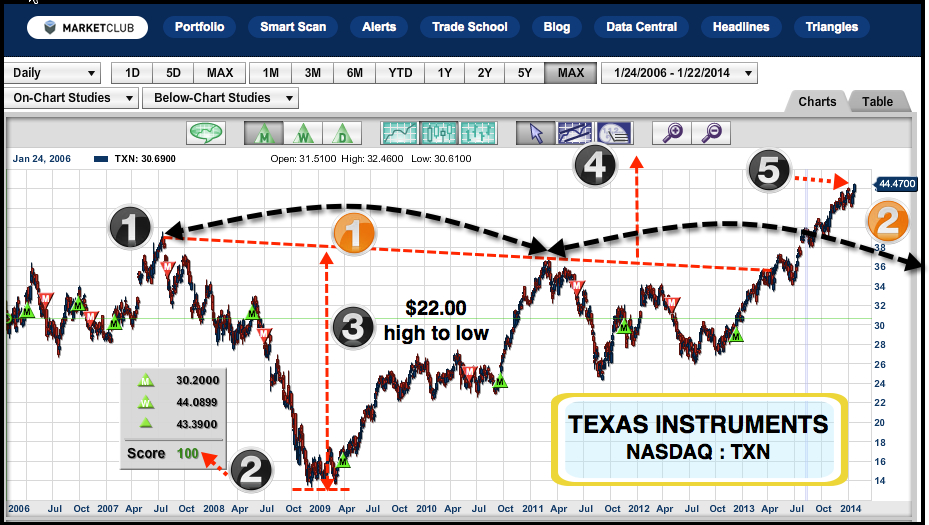
(Black Numbers)
1. Major resistance line.
2. All Trade Triangles are green and positive.
3. $22 measurement from black 3 to orange 1.
4. Upside target of $58 to $60 for this stock.
5. New highs today for Texas Instruments
(Orange Numbers)
1. 44-month cyclicality.
2. Next cyclic high in 6 to 8 months.
This pattern may change and I would highly recommend using sound money management principals and MarketClub’s Trade Triangle technology to manage risk.
To summarize, I expect the current positive trend in Texas Instruments to continue unless I see otherwise with the Trade Triangle technology. If I am correct in my analysis, I could potentially see Texas Instruments move up to the $58 to $60 area in the next 6 months.
Every success with MarketClub,
Adam Hewison
President, INO.com
Co-Creator, MarketClub
i need future silver dollor chart