In this post, I will take a deep dive into the chart structure of the precious metals as prices approach crucial triggers but on the opposite sides of each metal.
Let’s start with gold as it struggles to gain a foothold above $1200.
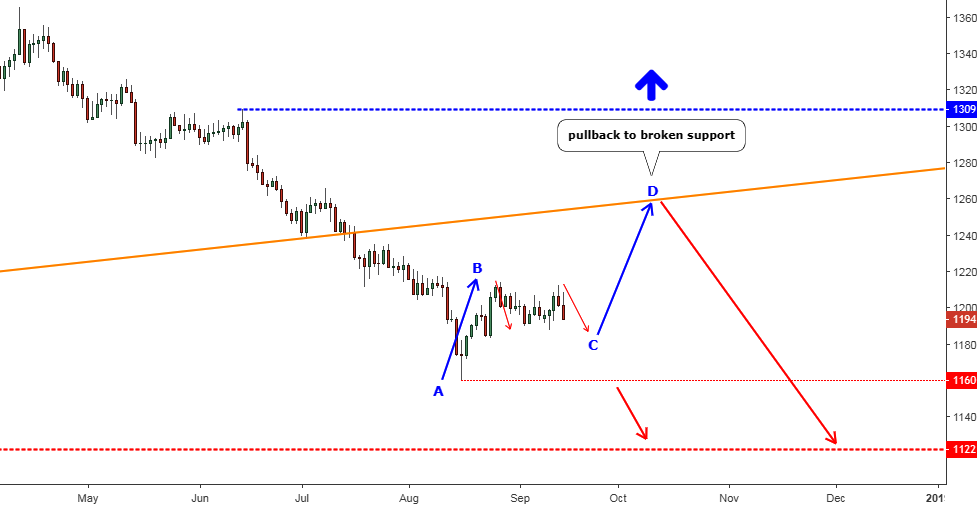
Chart 1. Gold Daily: Pullback

Chart courtesy of tradingview.com
The votes were split almost evenly in the poll in my earlier post about the gold’s outlook. Half of the readers chose the trigger of the upside resistance at the $1218 and the rest thought that the market would drop to retest the $1122. The metal price then was just a little bit lower than these days at the $1186.
Almost one month has passed since then, and to my surprise, none of the triggers were pulled although we were very close to the $1218 point, the market couldn’t push above the $1214 at the end of the August and then retreated below $1200. This month we could see the increasing activity as investors are back from their summer holidays. There was another attempt to clear the resistance last week, but it stalled at the $1213 and the significant level again remained untouched.
Despite two failures, short-term bulls are in a stronger position as gold hovers around the $1200 handle in the $1188-$1214 range. To retest the support, it should break below the multi-year low established in the middle of the August at the $1160, which is further from the current level than the upside trigger.
I think the metal is in a classic pullback move these days, which follows the breakdown of the orange support (built on the weekly time frame). I added two blue arrows to highlight the whole expected retracement. The first AB segment gained $54 from the low. Now the market is in a sideways consolidation (two thin red arrows), which would link the B and C points before the CD segment unfolds to touch the orange line. The latter should be larger than the AB segment as the distance to the broken support is pretty long. The touching point is around the $1260 and the expected starting point for the CD segment is around the $1180 level.
So, as the chart structure emerges I think we will clear the $1218 trigger, but the pullback will be just a pullback, and the metal should drop again. The Fed is believed to hike interest rate higher, and this would impose more pressure onto the metal. I will show my outlook for the interest rate in one of the upcoming posts.
A break above the $1309 (earlier consolidation’s top) would invalidate the bearish midterm structure. If the metal couldn’t build the second leg of the pullback to the upside, and there is such a probability if you would look into the silver chart below, then watch $1160 to be triggered.
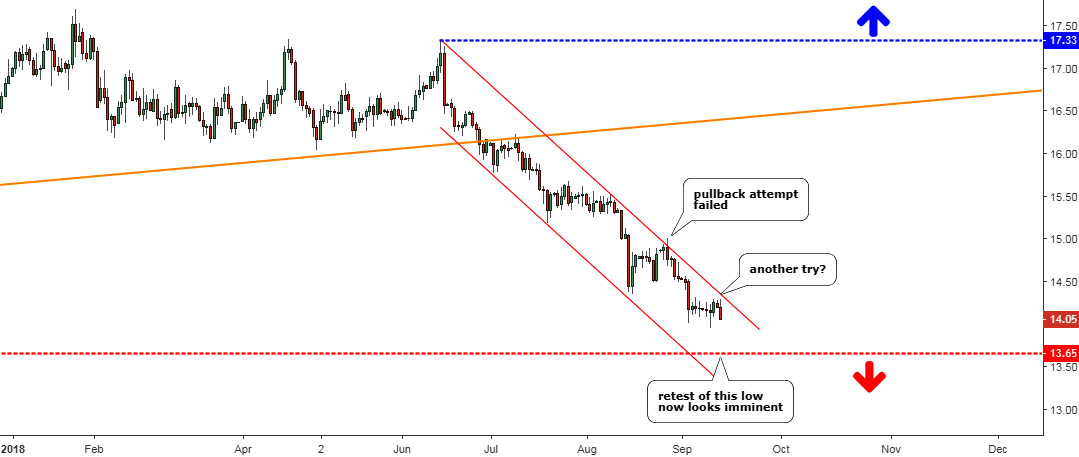
Chart 2. Silver Daily: Obeys Downtrend

Chart courtesy of tradingview.com
The majority of the readers (56%) had a bearish outlook for the silver, according to the voting results in the earlier post despite strong demand in the silver market at the Flash-Crash point (around $14.40) scared all sellers of the precious metals last month. The metal gained almost 5% from the low to touch the $15 handle within two weeks, but then it was just sold off again failing to crack the round number resistance.
Silver established a new low at the $13.94 last week as sellers got rid of the Flash-Crash phobia. In spite of this neither trigger was pulled so far, but the metal is closer to the significant downside level as gold eyes upside resistance. This is further evidence for those readers who ask why the gold/silver ratio matters. The ratio could finally reach the target set in one of my very first posts almost four years ago calling for the ratio to hit the unbelievable 109oz. It would mean a much weaker silver than gold against the dollar.
Now back to the silver chart. I built the red downtrend channel to show you how submissive the silver is. There was only one good attempt to make a pullback to the broken trendline (orange) described above. Another one last week was too pale to count it as the price erased all weekly gain just in one day, and this puts the shadow on the possible strong pullback in the gold market.
A retest of the major low at the $13.65 looks imminent now as the red downtrend turned out to be bullet-proof. Back in May, when the price of the metal was above $16, I wrote that silver looks into the dark abyss. These words appeared to be prophetic as the metal continues to the downside as if it was hypnotized by the abyss. These days it doesn’t sound exaggerated as there is no other strong support in silver after the $13.65 down till the $8.4 (October 2008 low). In gold, we have at least one more barrier at the $1046.
Another tragedy for silver is that the pullback area is too far now at the $16.40 level and the invalidation trigger is even further beyond the $17.33 where the current downtrend has started.
Intelligent trades!
Aibek Burabayev
INO.com Contributor, Metals
Disclosure: This contributor has no positions in any stocks mentioned in this article. This article is the opinion of the contributor themselves. The above is a matter of opinion provided for general information purposes only and is not intended as investment advice. This contributor is not receiving compensation (other than from INO.com) for their opinion.

Bonds are yeilding a little more these days, but we know more hikes are in store from the Federal Reserve who have signaled as clearly as they are able to for 2 more raises this year. One of them this month. Stocks are yeilding a little less, but prices are very rich. Metals are cheap, cheap, cheap and deserve a presence in everybody's portfolio. China is buying less gold and silver because their economy is being squeezed by tariffs. Who will pay for tariffs? US consumers will pay high prices for goods=inflation. We ARE going to get more inflation. RE prices are up, stocks are fully valued, bonds have nowhere to go but down. You can buy short term CDs, but to hedge against inflation, gold and silver have lagged and are what's left. Patience.
Silver us used in manufacturing. Gold is not.
Historically gold does tend to bottom out toward the end of the year. Check the monthly/ weekly longer term charts.