It's difficult to imagine that this energy commodity could offer a promising opportunity for profit when you observe its performance across different timeframes, including yearly, half-yearly, and even year-to-date. Below is a chart displaying its performance over the course of one year.
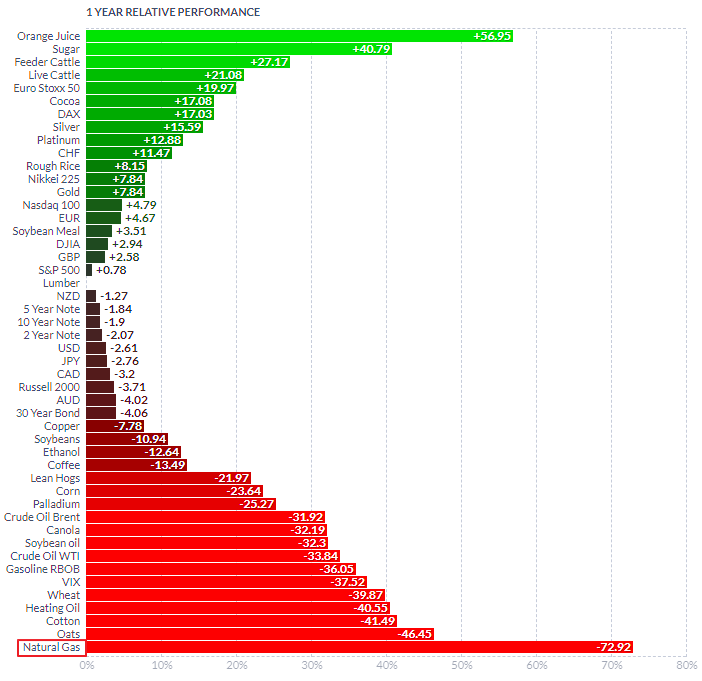
Natural gas futures have performed the worst among all commodities on the mentioned timeframes, losing 73% of their price in one year. They are almost double the percentage loss of the next worst-performing commodity, oats futures.
The chart below sheds light on the poor performance of natural gas futures. Continue reading "Natural Gas: Opportunity of the Year?"