Here we are on the final track of the year, and investors hope for the traditional Santa Claus rally in the precious metals sector. This euphoria of the anticipated strength based on the current move up could be spoiled if this pattern would emerge in the US dollar index (DXY).
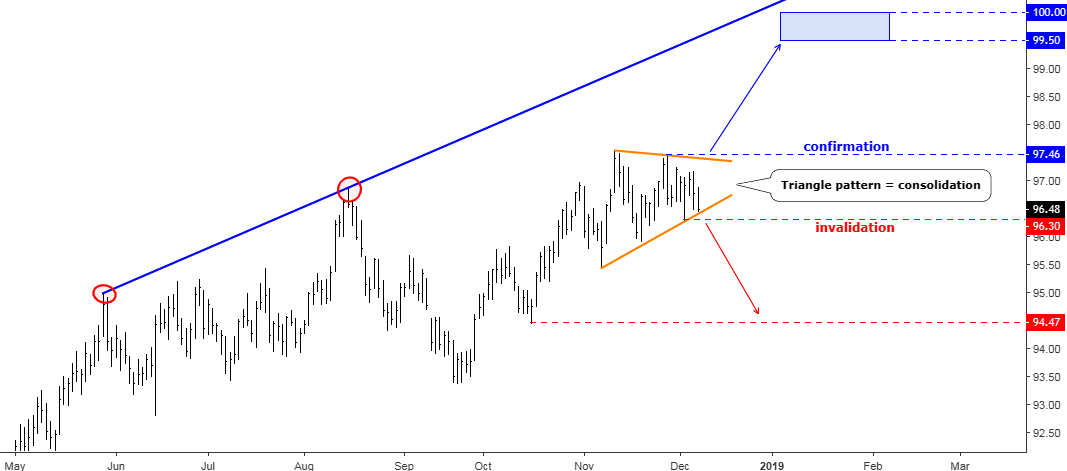
Chart 1. US Dollar Index Daily: Triangle

Chart courtesy of tradingview.com
The disappointing data of US non-farm payrolls released last Friday couldn’t damage the US dollar as it kept above the former trough established on the 4th of December at 96.30. The first reaction in the market was a USD sell-off against all major currencies, but it was short-lived, and none of the former extremes were breached. This made me focus on the Dollar Index chart to see if there is some pattern or trading setup has been shaping amid this unusual market behavior.
I detected a famous pattern and highlighted it in orange converging trend lines for you. It is a Triangle, which represents the consolidation stage in the market. This is a coiled spring, which could strike quite soon. The breakup would let the DXY rally to a triple-digit psychological level of 100, where both blue trend line and triangle’s target converge (blue box). The final confirmation would come on the breach of 97.46 level (former top). This scenario could stop the ongoing strength in top metals, especially gold as it has good progress.
The drop below 96.30 would invalidate DXY rally, and further weakness could target the former trough established this September at 94.47.
Now, let us check top metals charts if we can find signs of overheating there.
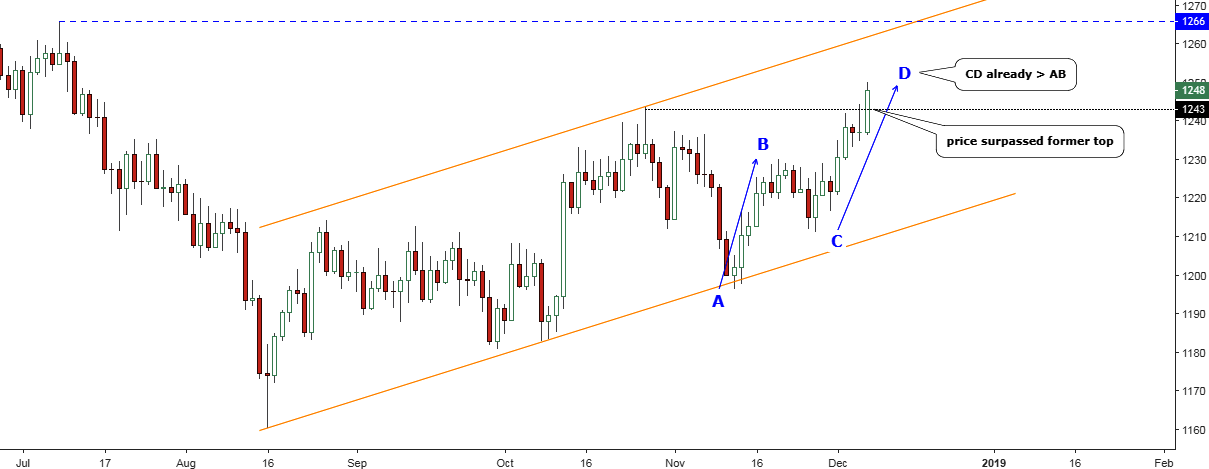
Chart 2. Gold Daily: All Minimum Targets Reached

Chart courtesy of tradingview.com
The gold price has been behaving according to scenario, which I posted at the end of November. The BC consolidation dipped right in the 50-61.8% Fibonacci retracement area before the CD segment emerged to the upside.
You were absolutely right a month ago as the majority of you had bet that the gold will update the October maximum of $1243. The yellow metal has hit the $1250 level right at the end of last week amid weaker than expected non-farm payrolls. Again, gold has accomplished all minimum requirements within the 3rd leg of correction. It surpassed the former top, and the CD segment of this last leg up is already 15% longer than the AB segment.
So, we could be at the climax stage of the entire complex correction, and the dangerous pattern, which was detected on the DXY chart couldn’t be just a simple coincidence. I would recommend you to be cautious and book partial or full profit here as another $10-$20 gain could be outweighed by the same amount of risk before you will accept the reversal when the price will breach the crucial $1230 level. Please keep in mind that this large orange structure shapes a Bear Flag pattern with certain consequences.
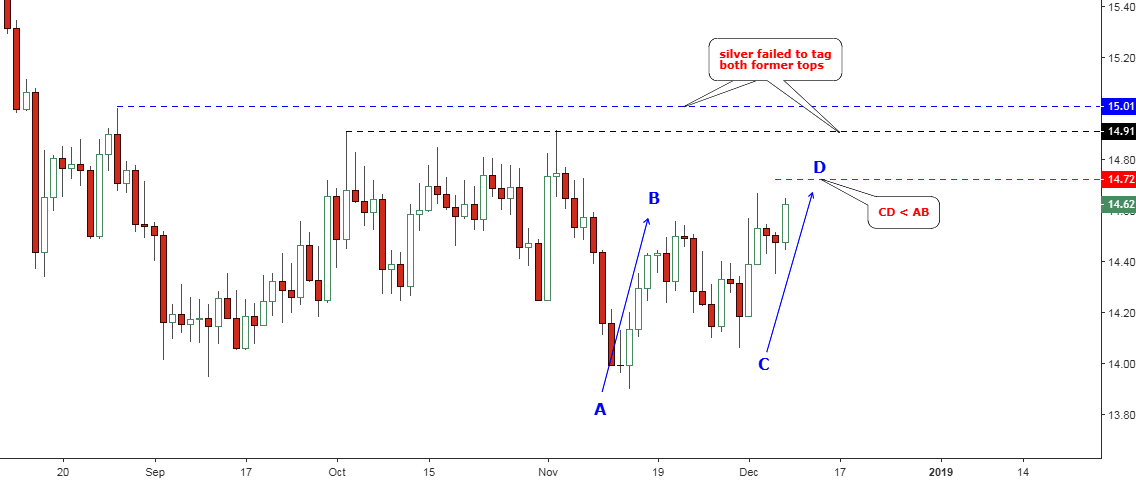
Chart 3. Silver Daily: Laggard

Chart courtesy of tradingview.com
The white metal also accurately fulfilled the plan posted at the end of November. Indeed, the metal retraced close to $14 as it was forecasted to complete the BC correction and then it has rallied within a CD segment of the 2nd leg up.
The silver is the laggard compared to gold as it failed to tag not only the former tops but also to accomplish the distance of AB segment in the CD segment, which is located at $14.72. The whole correction is flat, and the slope of it is to the downside as the second leg was underdeveloped hence it is lower than the first leg.
But I am observing silver as it clearly shows what happens in the market of precious metals. It doesn’t feed the illusion of the rally, which could emerge based on the strong move to the upside in the gold market. Here we have a clear range-bound flat correction, which implies further weakness ahead. The silver is not as strong as gold, and it could be the first prey once the dollar turns bullish again.
One should be cautious with the silver longs and the same recommendations, which I gave under the gold chart, are valid for the silver trading as well. Any positive result is our gain, and here we have a good profit to be booked.
Intelligent trades!
Aibek Burabayev
INO.com Contributor, Metals
Disclosure: This contributor has no positions in any stocks mentioned in this article. This article is the opinion of the contributor themselves. The above is a matter of opinion provided for general information purposes only and is not intended as investment advice. This contributor is not receiving compensation (other than from INO.com) for their opinion.

I have never seen any profit in precious metals. A poor investment sector no matter how you buy in it. Get some "Pot" stocks and take a fantastic ride to recover that gold and silver loss.
That's funny. you must not have a clue what you're doing then. Granted metals have been stuck for the past few years. But the time to buy was when Gordon Brown was selling England's gold, not today. Don't bash the sector because you weren't smart enough to know when to get in. Besides it's not an investment anyway. Anyone who needs that statement explained shouldn't be even thinking about metals at all. Something more mindless - like pot stocks - will suffice.
Seasonal statistics are not on your side. Over the past 43 years, the dollar has declined by an average of 1.24% in the month of December, and declines outnumbered rallies by roughly a 7:3 ratio. This has to do with the balance sheet date at the end of the year, which favors movement of funds from USD to EUR. As to silver not confirming gold: first of all, while gold has seasonal strength in December, Silver's strongest seasonal month by far is January. Restocking of inventories is apparently concentrated in that month - contrary to gold, silver is mainly an industrial metal, and is therefore driven by the seasonal trends of industrial metals. Lastly, suppose a cyclical bull market in gold has begun - I'm not asserting that this has happened, but let us assume for argument's sake it has - then silver's behavior would not really tell you anything, as it traditionally lags gold in early in cyclical bull markets.