Both metals went amazingly well with the plan that I shared with you a month ago. I have shown you a possible structure of more complex correction and set the time targets for both metals. Below you can see where you thought the completion of the corrective move would finish.

The votes were split almost even with a little margin in favor of the gold bugs as they preferred January 2020 as the ending point for the current extended correction. Silver fans chose Christmas day as their metal's chart showed it as a result of calculations.
Later on, there was an update where I set the price targets for both gold, and silver for the upcoming drop as the structure got more clarity.
As time goes by and the chart moves to the right, adding more and more bars, we can see the picture even clearer now to adjust both time and price targets for top metals below.
Chart 1. Gold Daily: Faster & Deeper

Chart courtesy of tradingview.com
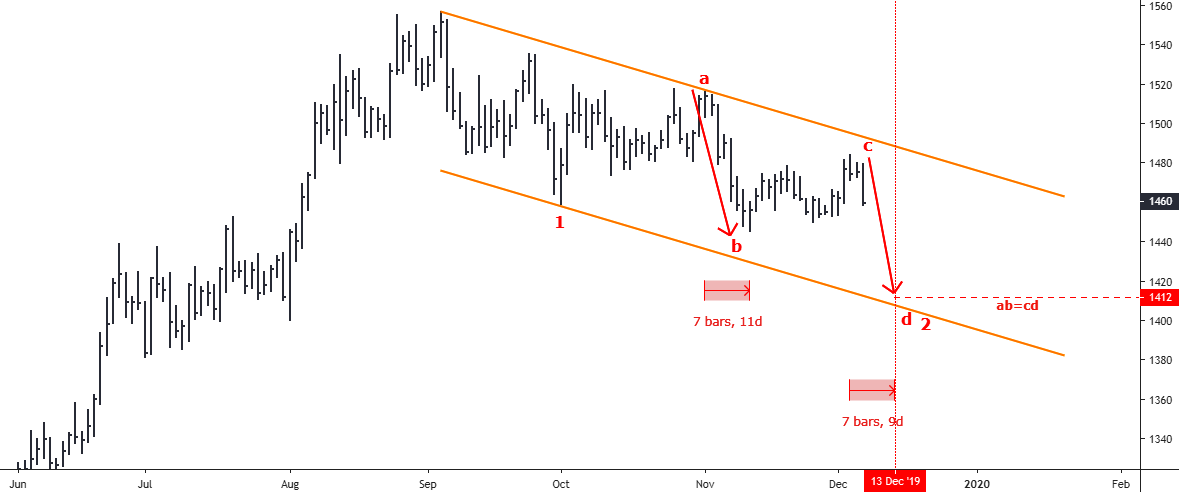
The gold price was about to finish the first leg down (red "ab" segment) within a last larger move to the downside at my earlier update. According to the chart plan of this complex correction, I anticipated the further reversal to the upside, which indeed took place as gold bounced back up from the $1446 low to the top at $1479 as price retraced the half of the "ab" segment.
In hindsight, it is clear that the "bc" segment of a small consolidation also unfolded in two legs. But I guess many sellers at the top of the first leg up were trapped and maybe forced to quit with a loss during the second leg up as it overcame the earlier top of $1479 to reach the $1484. Stop hunters from the "whales" pack quite often use these tricks to make easy money. I hope none of our readers got hurt as I showed you beforehand the path within a rose clone of the first move down.
Now, after the "ab" and "bc" moves unfolded, we can calibrate our target to the downside as we got both distance and the starting point for the "cd" segment. I use small letters to call these segments as it has a lower degree. The "cd" = "ab" at the $1412, which is slightly lower than the 2=1 (larger segments) at $1418. Interestingly, the 50% Fibonacci retracement level is located at $1411. Add here the downside of the trend at $1408. All in all, we got strong support in this area between $1408 and $1418. Most of you chose this area during an earlier ballot as a target for a gold drop.
Let's not forget about adjusting the time target as well. The "ab" segment took 7 bars to unfold, and if we add it to the "c" point, then the time target falls on the 13th of December, which is much earlier than we calculated using different approaches before.
Chart 2. Silver Daily: Sticks To Earlier Targets

Chart courtesy of tradingview.com
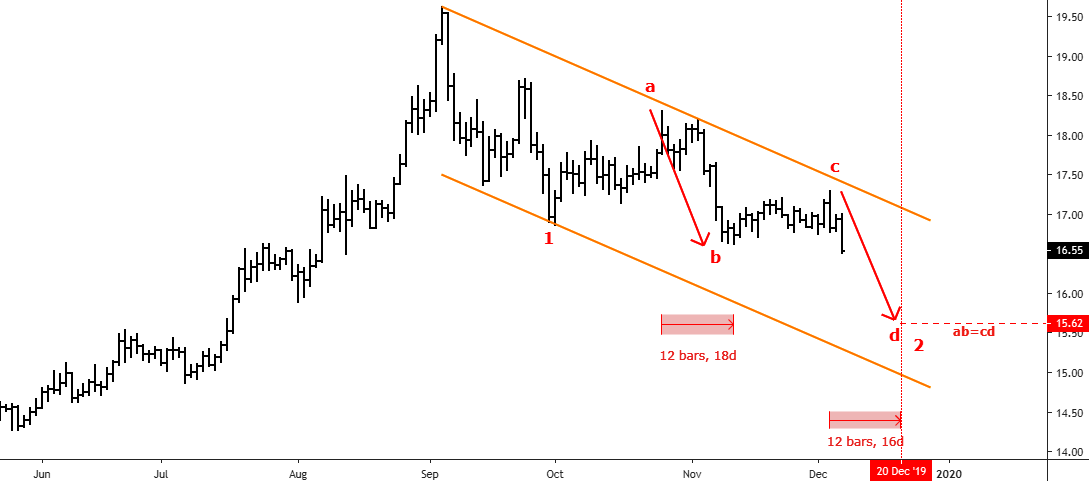
Silver, indeed, had set the pace for both metals as I told you earlier this metal helped me to identify the upcoming complexity of the structure of both metals to warn you on time as it showed sharp declining zigzags followed by unconvincing corrective growth. These zigzags have been repeated now in the second leg down. So, it is always good to watch both metals, even if we choose only one of them for trading. The freshest example, silver has already broken below the "b" point at $16.63, giving us the confirmation for the further price decline. Gold should drop below $1446 to catch up with the falling silver "knife."
The adjusted price target for silver is now located a little bit higher at $15.62, where the "cd"="ab." To remind you, the 2=1 target was set at $15.56 before. Most of you had voted that silver could drop to an extended target (1.272 ratio) of $14.81. It is interesting as gold votes are different. Let's see.
It is amazing, but the new calculations of time target using ab/cd segments point on the same date of the 20th of December as it was calculated earlier based on a totally different approach.
Intelligent trades!
Aibek Burabayev
INO.com Contributor, Metals
Disclosure: This contributor has no positions in any stocks mentioned in this article. This article is the opinion of the contributor themselves. The above is a matter of opinion provided for general information purposes only and is not intended as investment advice. This contributor is not receiving compensation (other than from INO.com) for their opinion.
