
Our research team warned of a peak in the Financial Sector ETF on June 10, 2020, with this article.
It was important to understand the technical setup that existed at that time and what the Fibonacci Price Modeling system was showing then. There was very clear support near $23 that was highlighted by the Fibonacci Price Modeling System, and we were very clear in our future price predictions within that article.
"The $27 price peak sets up directly between our two Fibonacci Daily upside price target (Peak) levels. We believe this setup is a very strong indication that a move to below $23 may be setting up over the next 30+ days. The Q2 data may very well push investors to re-evaluate the potential for the Financial sector if delinquencies and at-risk borrowers continue to default in greater numbers."
The timing of our original article could not have been better for skilled technical traders. Since that June 10, 2020 article posted, the XLF price has fallen almost exactly to $23 (-10.15%).
Currently, the FLX price is recovering just above the price gap that will act as the next "window" for the price to attempt to fill. Skilled technical traders should watch the Breakdown Gap that setup between June 10 and June 11 as an upper window of resistance (between $25.20 and $24.35). The XLF price may likely attempt to breach or fill this gap window before initiating another downside price move targeting levels below $22.
Daily XLF Chart
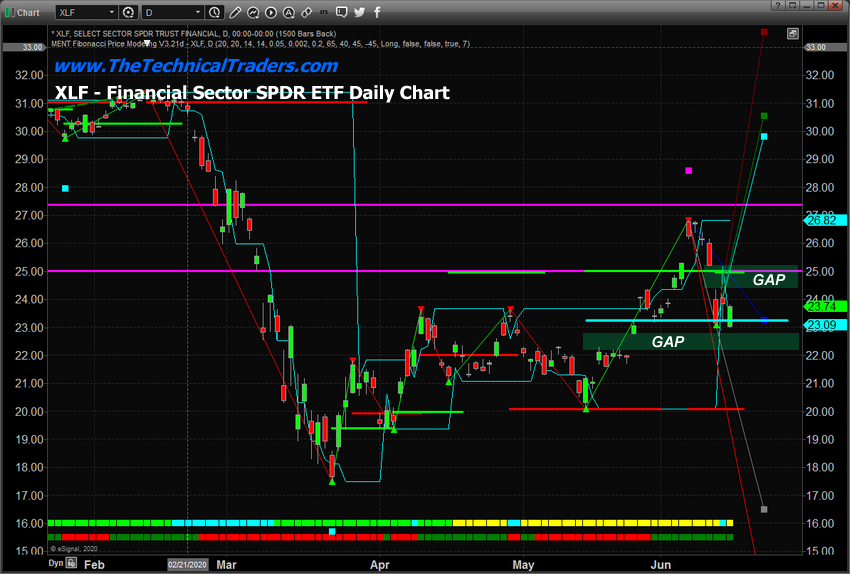
It is our opinion that should sudden price weakness drive price levels lower, away from the upper gap range the weakness in the financial sector could create a series of new lower price gaps as XLF price levels attempt to gap downward – through $22, then $20, then ultimately the $18 to $19 price level.
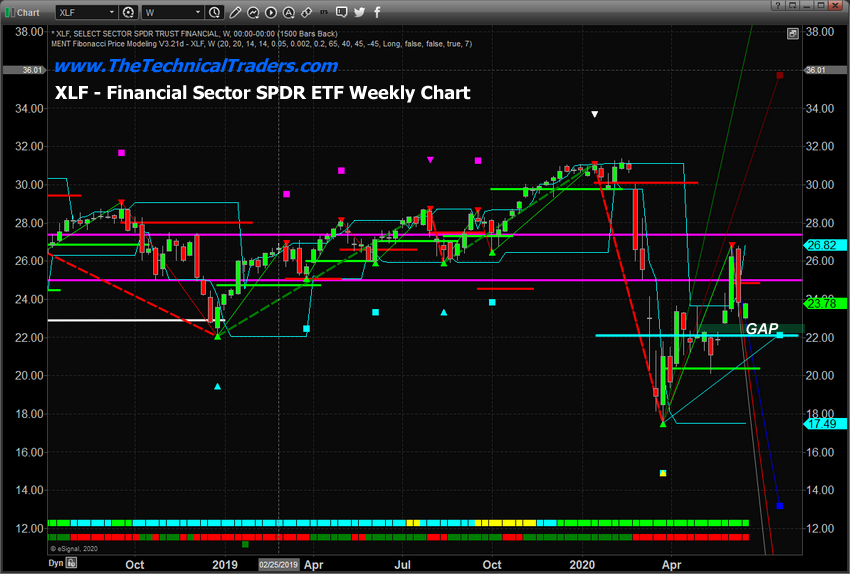
This Weekly XLF chart highlights the longer-term Fibonacci Price Modeling System's expectations showing the current downside price move has broken below the Bearish Fibonacci Price Trigger Level near $24.87. At this point, the next lower support level is near $22.10 – just below the lower Gap level.
It is our opinion that the financial sector ETF will attempt to break below $22 in the near future and may attempt to fall to levels near or below $20. The current support in the market from the $23 level may prompt a move into the upper Gap level before the next downside move begins – although we feel that is not likely to happen.
Weekly XLF Chart
Watch for a breakdown in price trading below $23.50 as an indication that weakness has prompted price to trade below the recent "Belt-Line" price level. We believe a new close below $23.50 would be a good indication that the lower Gap is about to be filled, and a more in-depth price move may take place targeting $20 to $21 for this financial sector ETF.
As the Q2 data starts to hit the news wires over the next 4+ weeks, we believe risks to the financial system will become very evident as a result of the COVID-19 shutdown. Be prepared for increased volatility in almost all sectors and the very real potential for a retest of recent low price levels.
You don't have to be smart to make money in the stock market; you just need to think differently. That means: we do not equate an "up" market with a "good" market and vi versa – all markets present opportunities to make money!
We believe you can always take what the market gives you and make CONSISTENT money.
Learn more by visiting The Technical Traders!
Chris Vermeulen
Technical Traders Ltd.
Disclosure: This article is the opinion of the contributor themselves. The above is a matter of opinion provided for general information purposes only and is not intended as investment advice. This contributor is not receiving compensation for their opinion.
I agree with the down forecast
Hi Chris..Once again I must differ with you folks' forecast of XLF as I did on Jeremy's forecast of SPY. And once again I base my opinion on a weekly chart. Here is my analysis of XLF. On 6-8-20, the weekly EMA 10 crossed up through the SMA 18 on XLF, which for me is an indication of a new trend starting, albeit still just below the weekly SMA 50, which is a bit of concern I confess....Also, on 4-30-20 XHB made the same cross above which bolsters my confidence in the above as a lot of the time financial stocks and home building stocks move in lockstep....Ok Chris, that's my story, what say you?....Ron D