One of our readers requested the update on cryptos, including Ethereum, this week. Here we go.
The leading coin has taught us excellent lessons recently. I shared with you a bullish setup for Bitcoin a month ago. In the following update, I recommended to move the stop loss higher from $50k to $55k area to cut the risk after the breakout and increase the risk/reward ratio to sound 2.7.
The price indeed broke above the confirmation level of $61782 and quickly reached the new all-time high in the $65k area, but then it failed to advance.
We have the first lesson here from the RSI. As we can see on the sub-chart, the indicator did not confirm the new all-time high as it established a lower peak instead. This built the Bearish Divergence then, and the outcome you already know, the price collapsed dramatically.
Here comes the second lesson. If you followed my advice to limit the risk at a higher level of $55k, then the loss was much smaller than it was at the initial $50k level. The price dropped hard to $47k, and the initial stop would not survive either, making it more painful to face. One could not control the price, but he can control the risk.
Get Our Stock of the Week
Uncover the most undervalued and unappreciated stocks with our free, weekly newsletter. You'll get a new stock analysis every Tuesday!
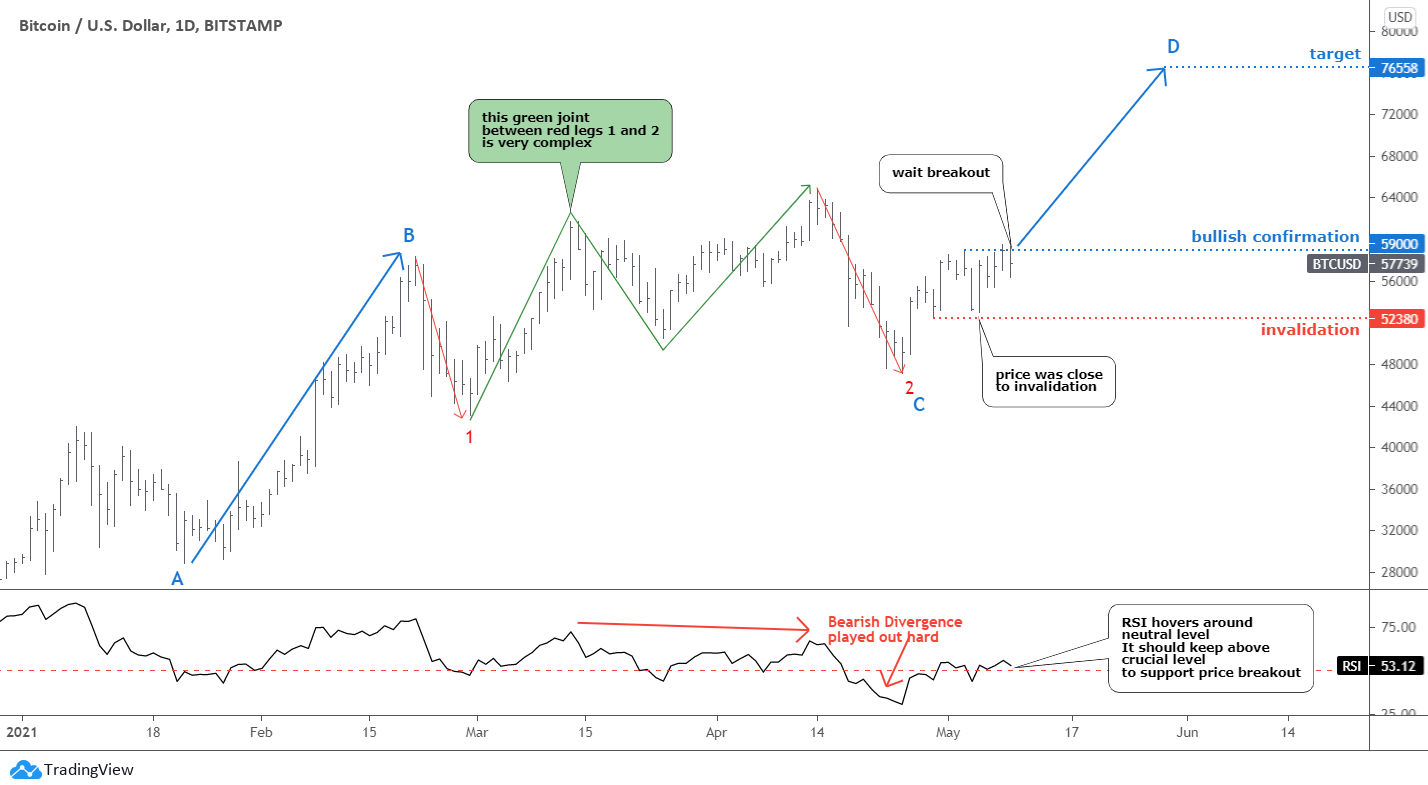
The outlook on Bitcoin remains bullish. The structure of the BC part has changed as the green joint between red legs 1 and 2 was extended. Each of its two legs up contains smaller two parts to the upside. This is the tricky nature of all corrections.
The leading coin is in the “Make it or break it” situation right now. The price bounced strongly after the hard collapse and now is in a minor consolidation. The stop loss area was set at the previous low of $52k, and the recent drop was only $500 away to trigger it.
The bullish confirmation level is set at the top of this bounce at $59k. One should wait for the breakout before entering the market. The target was set at $76558 at the equal distance of the AB segment applied to the new C point. The risk/reward ratio is good, around 2.7.
The RSI is neutral so far, and it should keep above the crucial 50 level to support the breakup.
Most of you were Bullish last month.
The second-largest coin with a market cap of over $400 billion is Ethereum. It recently surpassed NVIDIA Corp., Mastercard Inc., and Walmart Inc., by this value made its founder Vitalik Buterin, the youngest billionaire in its 27.
If Bitcoin is “digital gold,” Ethereum is the revolutionary blockchain platform with smart contracts that could be executed automatically using the code.
There is a hype about the use of Ethereum in so-called decentralized finance or DeFi. It is a blockchain-based financial service; this could be a game-changer for the entire financial industry. For instance, the European Investment Bank issued its first-ever digital bond using the Ethereum platform last month.
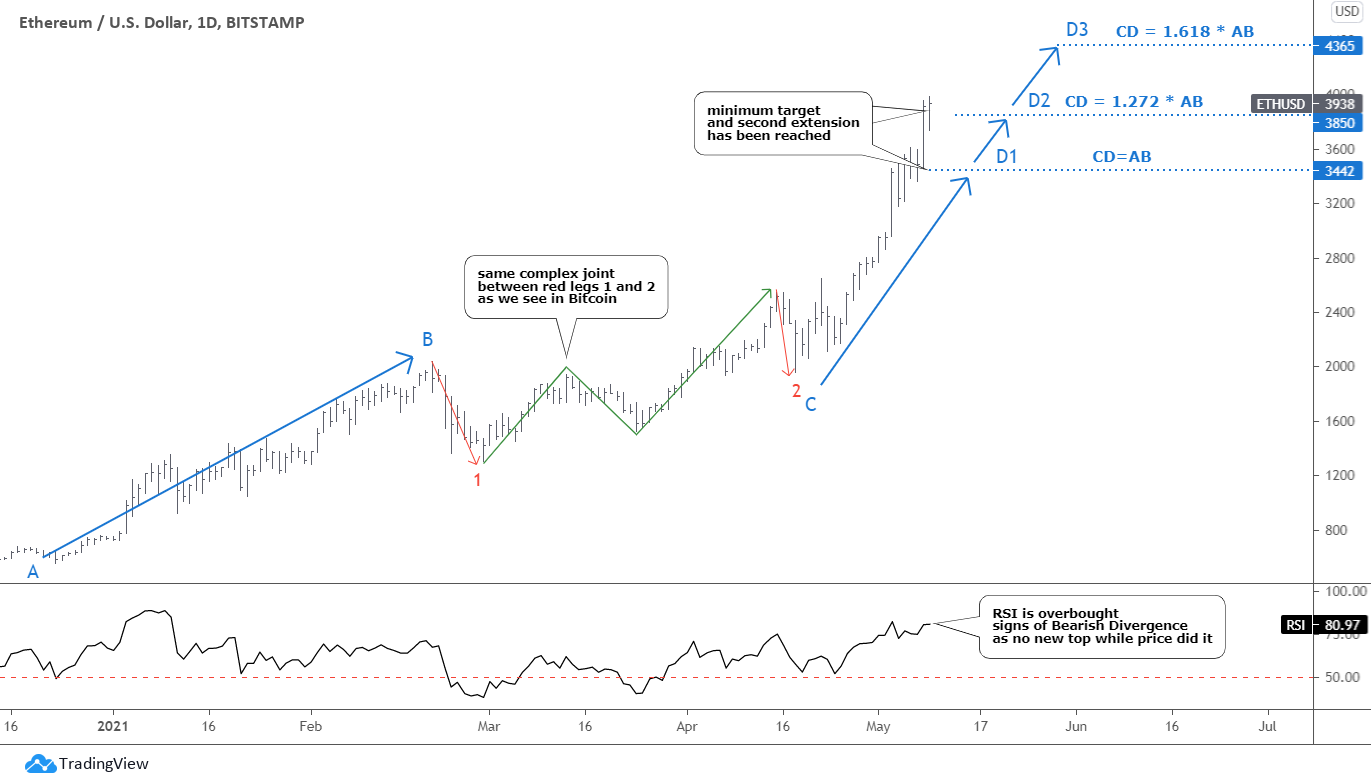
We can see the same structure of the BC part in Ethereum as we witnessed in Bitcoin above. It is a substantial green joint between two red legs down. Someone could notice that there was no Bearish Divergence like the one we saw in the Bitcoin chart ahead of the drop within red leg 2. This means that Bitcoin was the main influencer in the crypto world in that particular period and in all previous history.
Bitcoin's power has been shaken at the end of last month when the hype-driven rally of Ethereum reached the first target of $3442 where the CD segment is equal to AB part. Recently, it hit the second target after a minor consolidation, it was a rocket move, and it looks like more and more investors accepting Ethereum. This is what we are waiting for to emerge in the Bitcoin chart.
The next is the 1.618 ratio of extension marked as D3 target at $4365. I added it for Ethereum enthusiasts. Some of them call for a $10.000 target, at this point, and on this time frame, it is not visible yet.
The RSI is in the overbought condition as it has early signs of a Bearish Divergence, as the new all-time high was not confirmed in the indicator’s sub-chart. I think it should retrace down as well as the price to be able to establish a new maximum.
Wait until the market will give us new clues, crypto-traders should pray for a sideways consolidation to emerge as the harbinger of another move up.
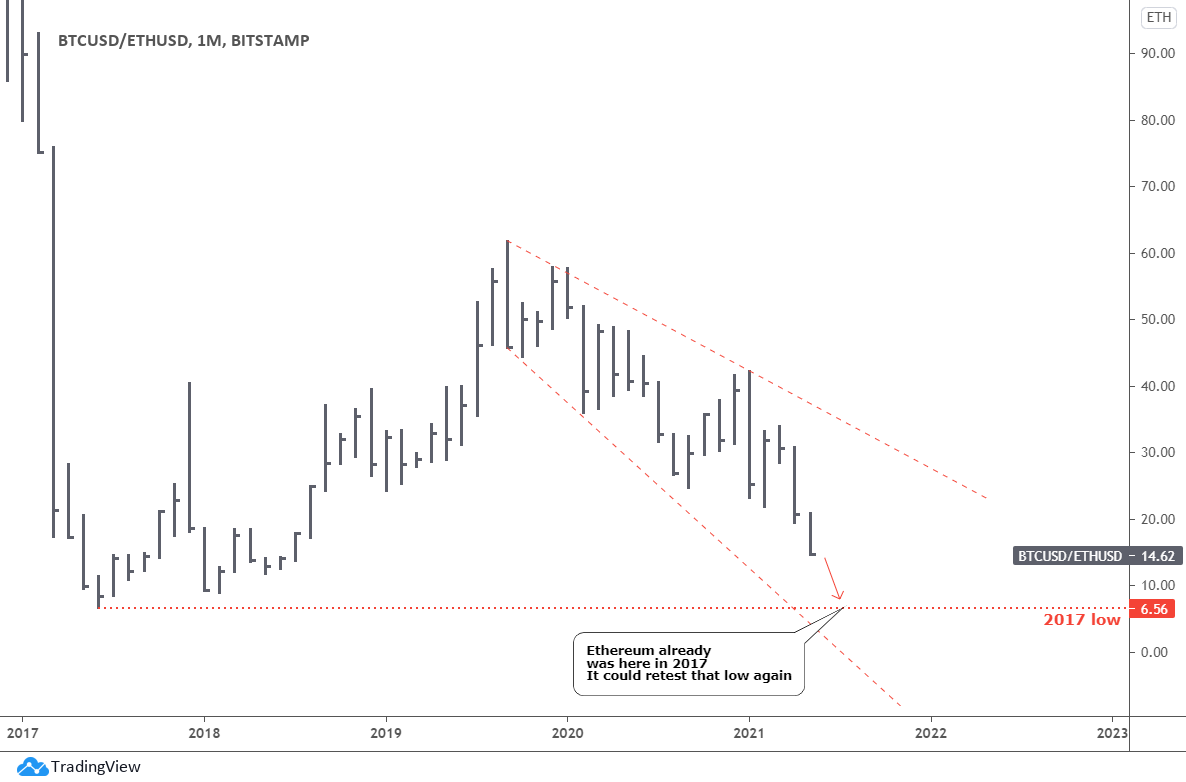
The most interesting is the ratio of Bitcoin price reflected in Ethereum. Below is the monthly chart of this ratio.
I think we can title this chart “Crypto-Revolution Is Coming”. The more adoption by the cyber-society of Ethereum platform with a vast range of implications the stronger value of the coin.
It is amazing how Bitcoin loses its value or Ethereum gains it over time as it was a triple-digit ratio and now it streams to a single digit. It was already in that area when the ratio bottomed in 2017 at 6.56 ETH per Bitcoin. There was a bounce during the large pullback until September 2019. Then the ratio started to collapse in a wide zigzag within the red expanding downtrend.
There is no other support except the 2017 low at 6.56 ETH. The ratio should lose more than half of its current value. Let us assume if Bitcoin will hit $76k and Ethereum will retest the low in ratio then its price could be at more than $11k. However, these parameters are not in a direct relationship, so everything could happen, but this is one of the options.
Intelligent trades!
Aibek Burabayev
INO.com Contributor, Metals
Disclosure: This contributor has no positions in any stocks mentioned in this article. This article is the opinion of the contributor themselves. The above is a matter of opinion provided for general information purposes only and is not intended as investment advice. This contributor is not receiving compensation (other than from INO.com) for their opinion.


Maker. It’ll be in the double digits in a couple of months-Mark my words. -EC